Welcome to POLS 1600
Updated Apr 22, 2025
Reasons to take this class
- You want to change the world
![]()

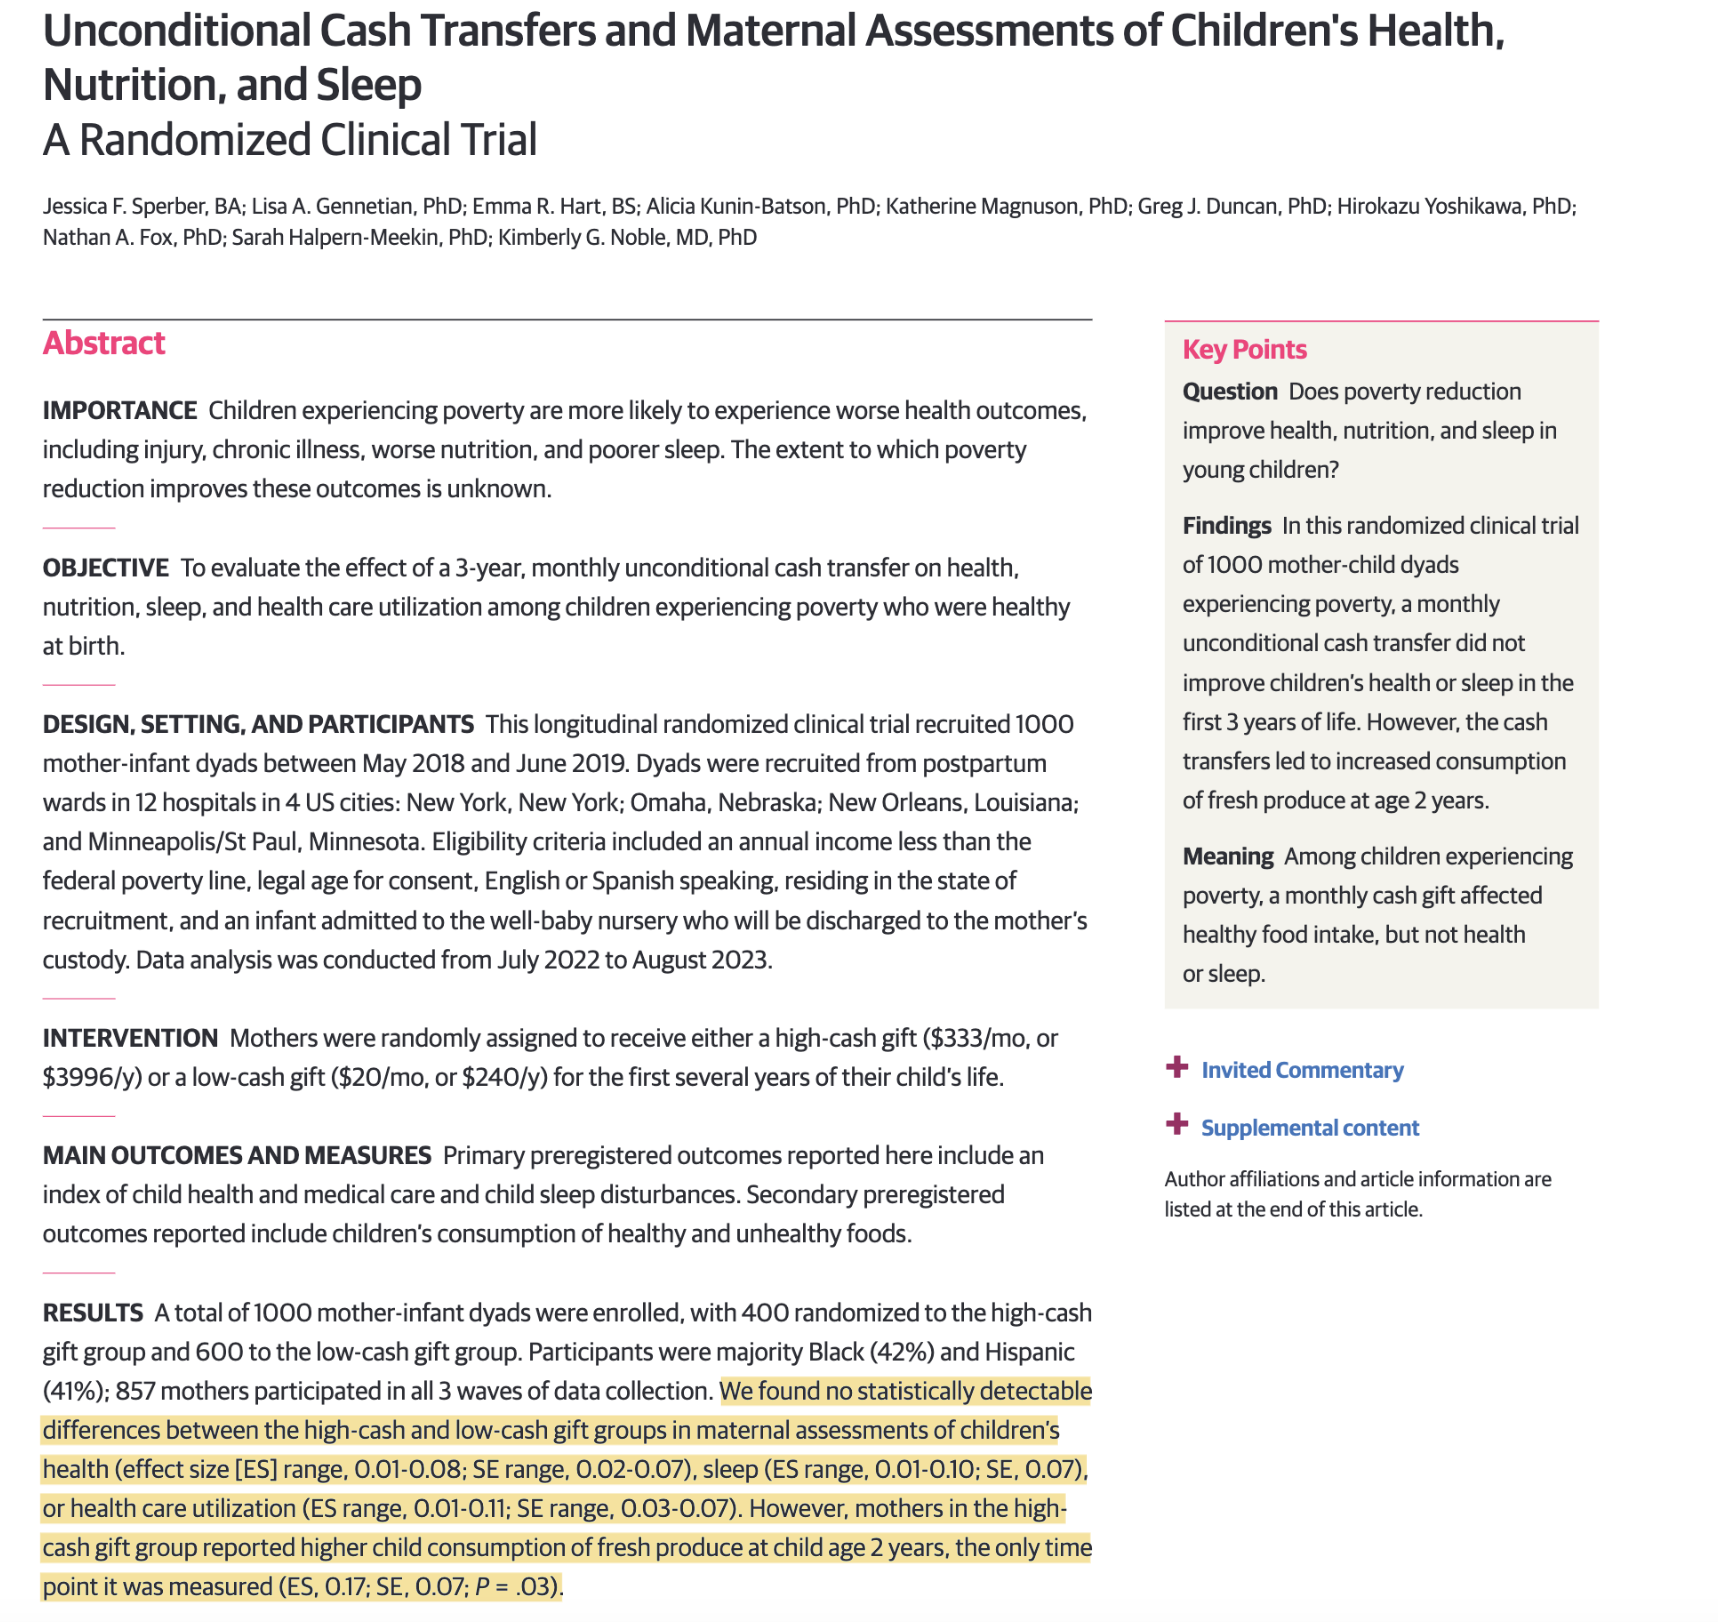
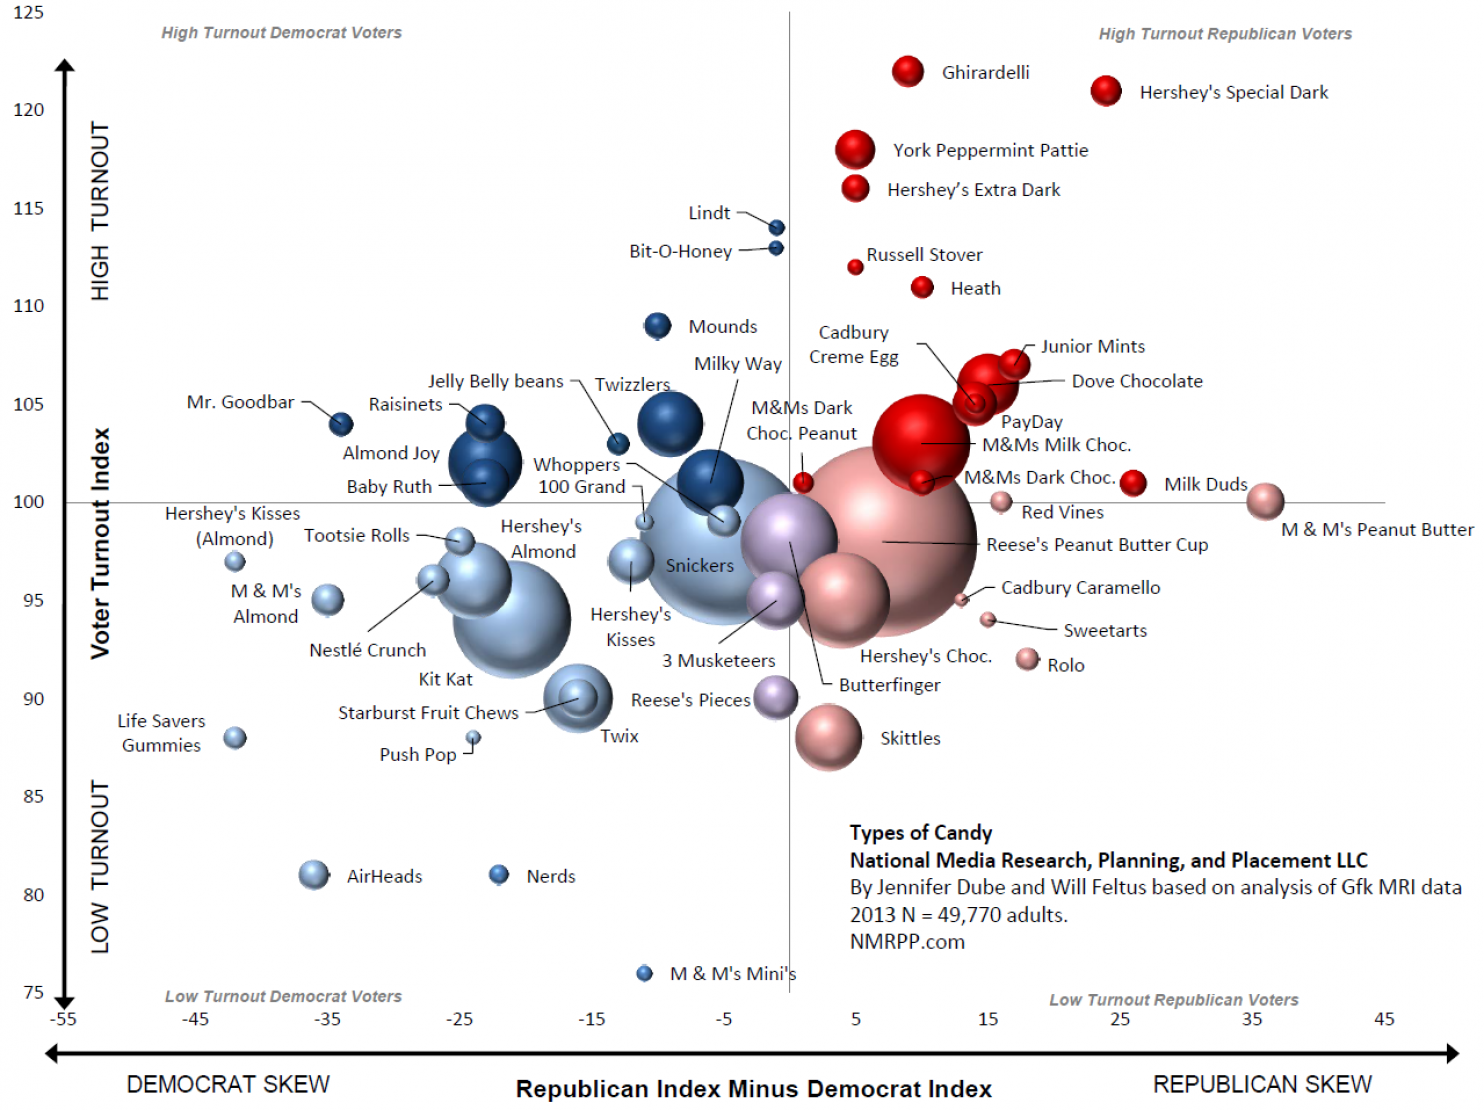
Why might we be skeptical of these results?
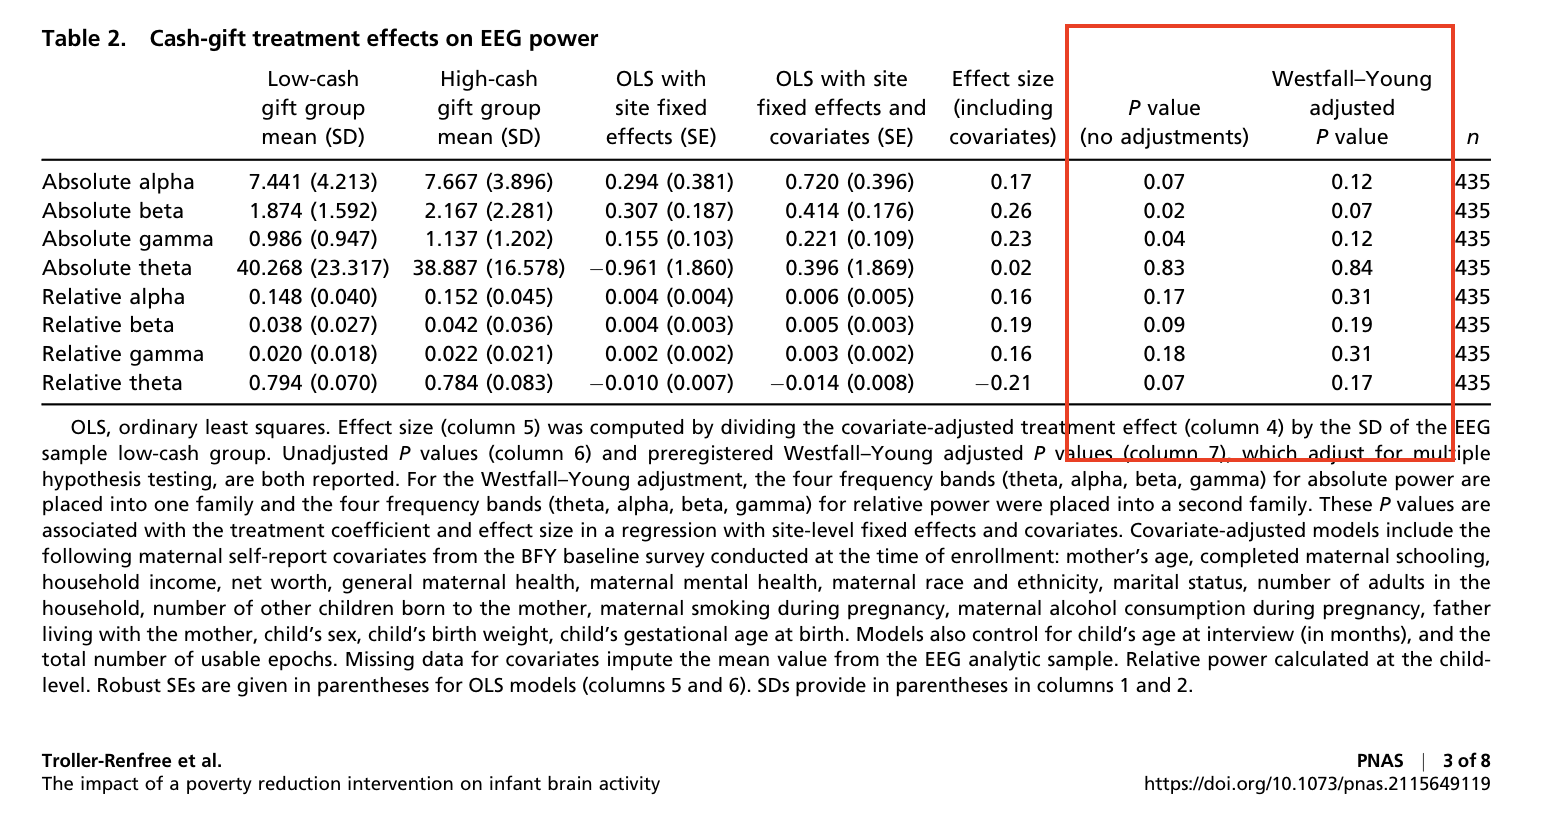
Why might we be skeptical of these results?

Source: Andrew Gelman
Why might we be skeptical of these results?

Source: Andrew Gelman
Why might we be skeptical of these results?
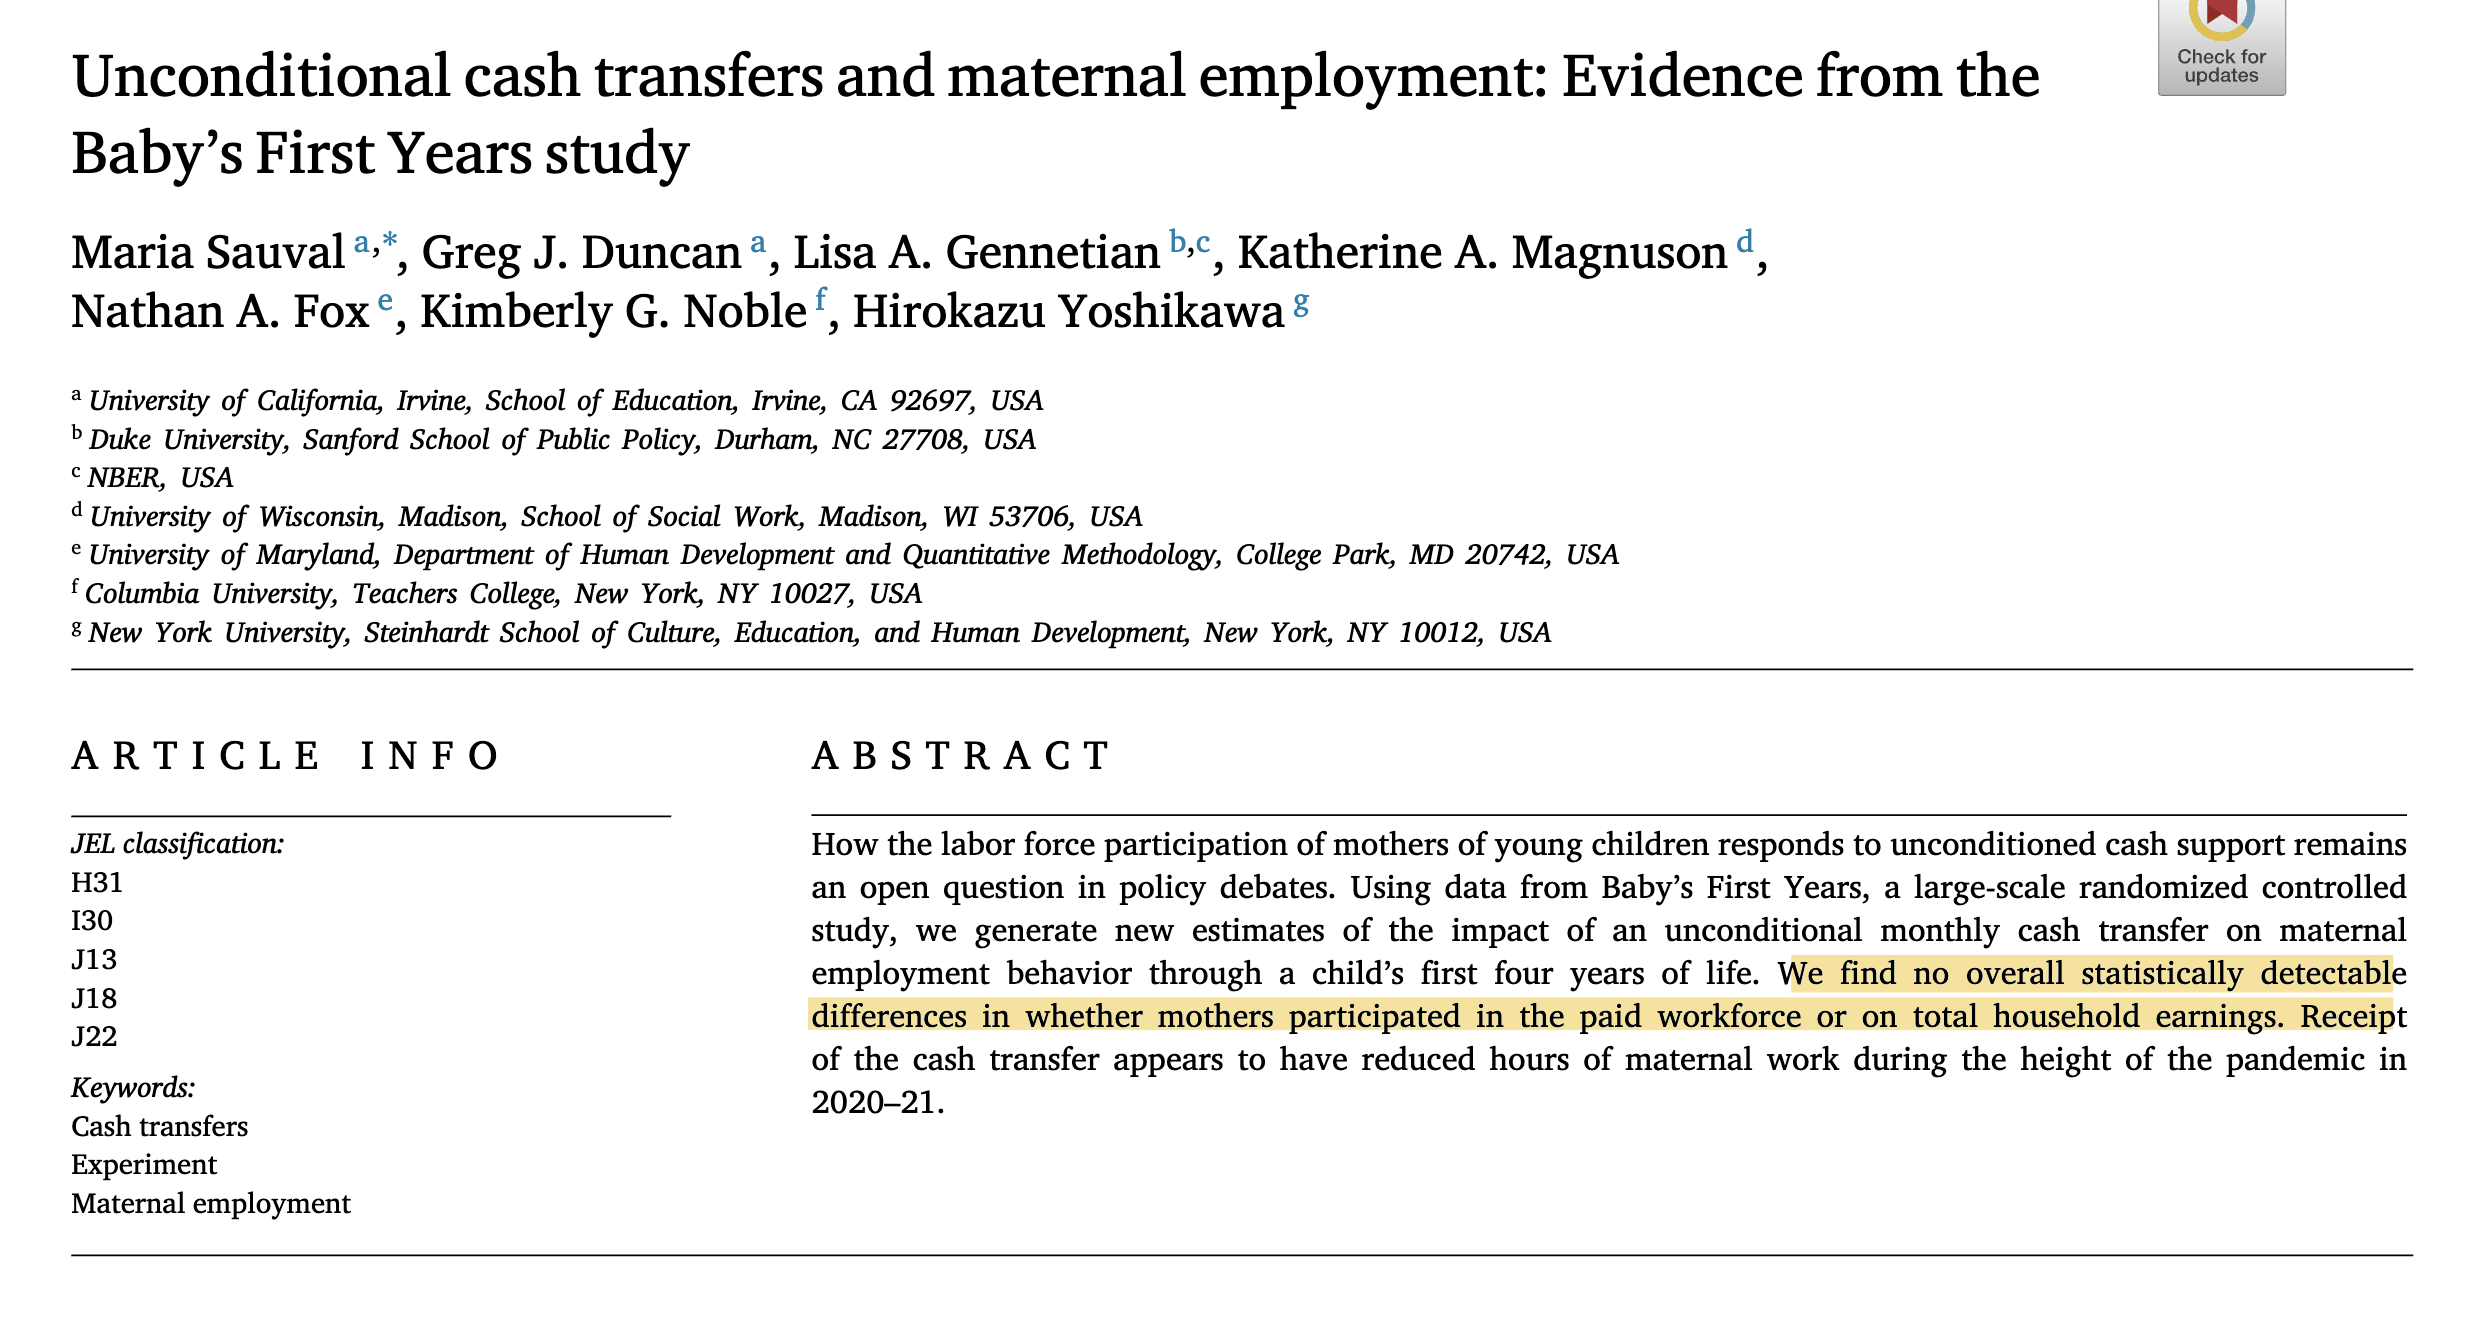
Why might we be skeptical of these results?
Software and computing
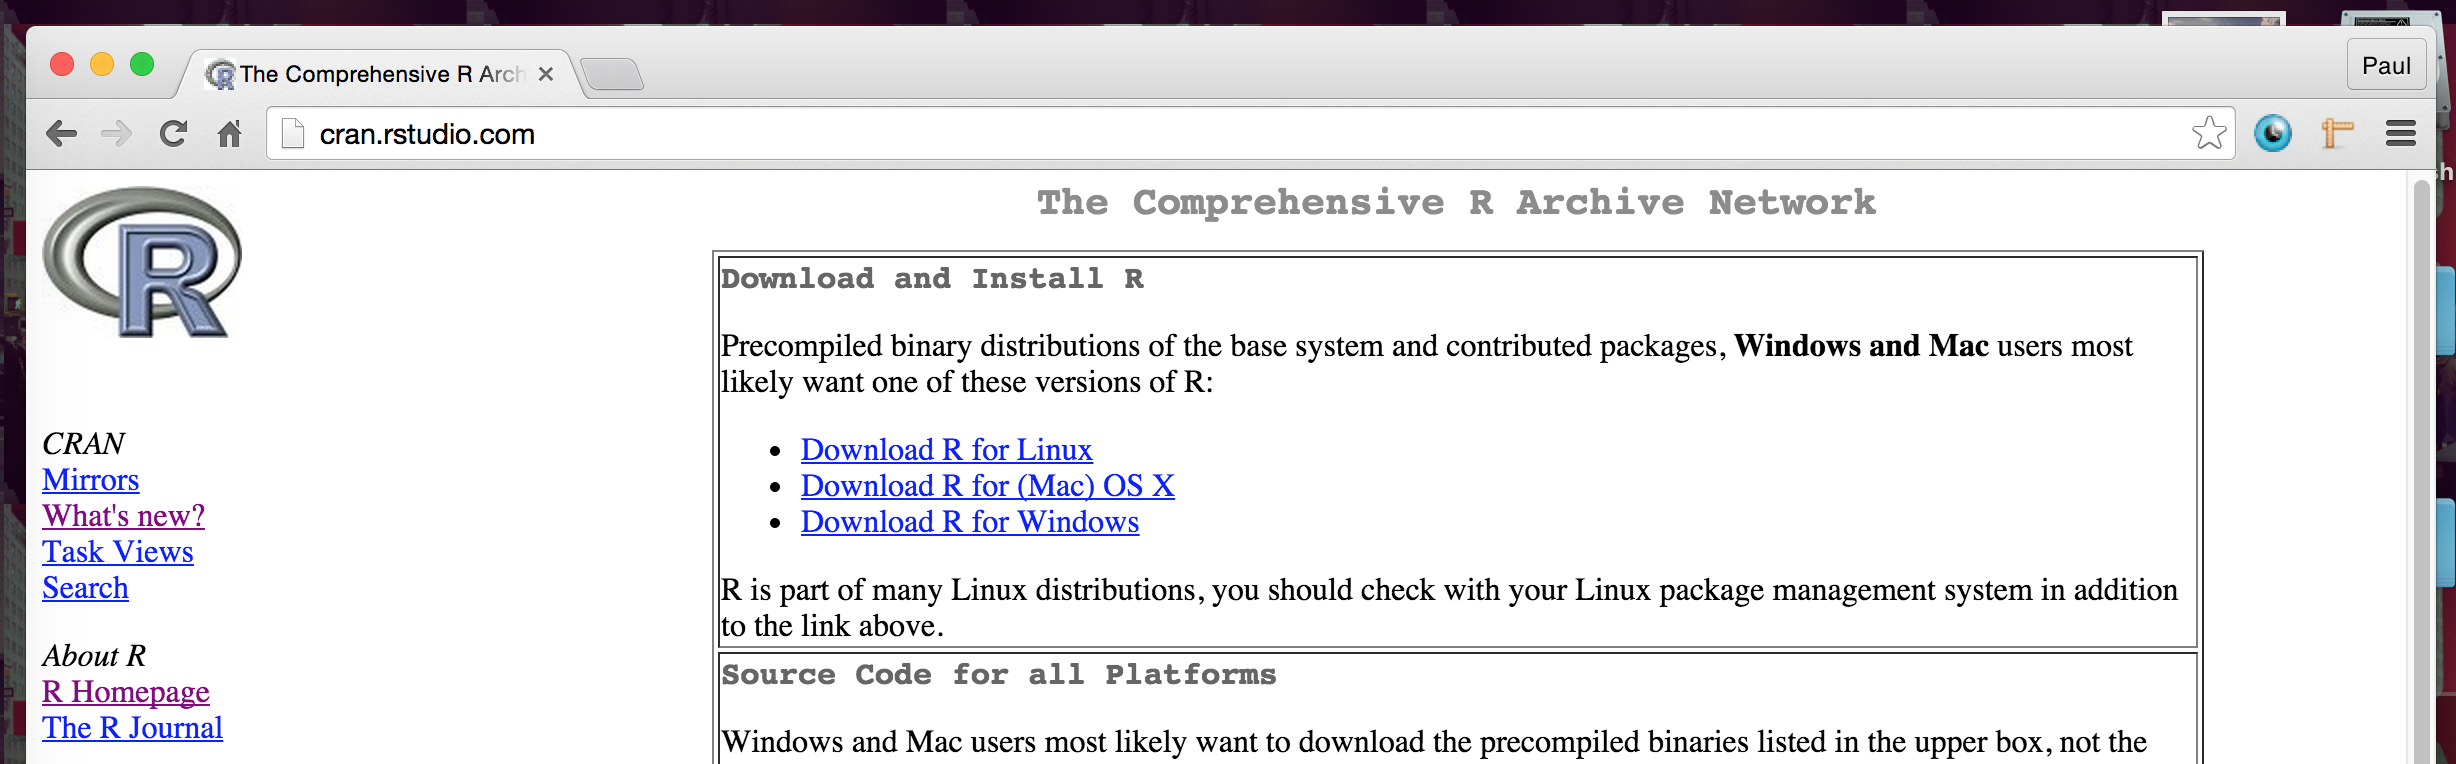
- Statistics done using R
- Open source (free) statistical language
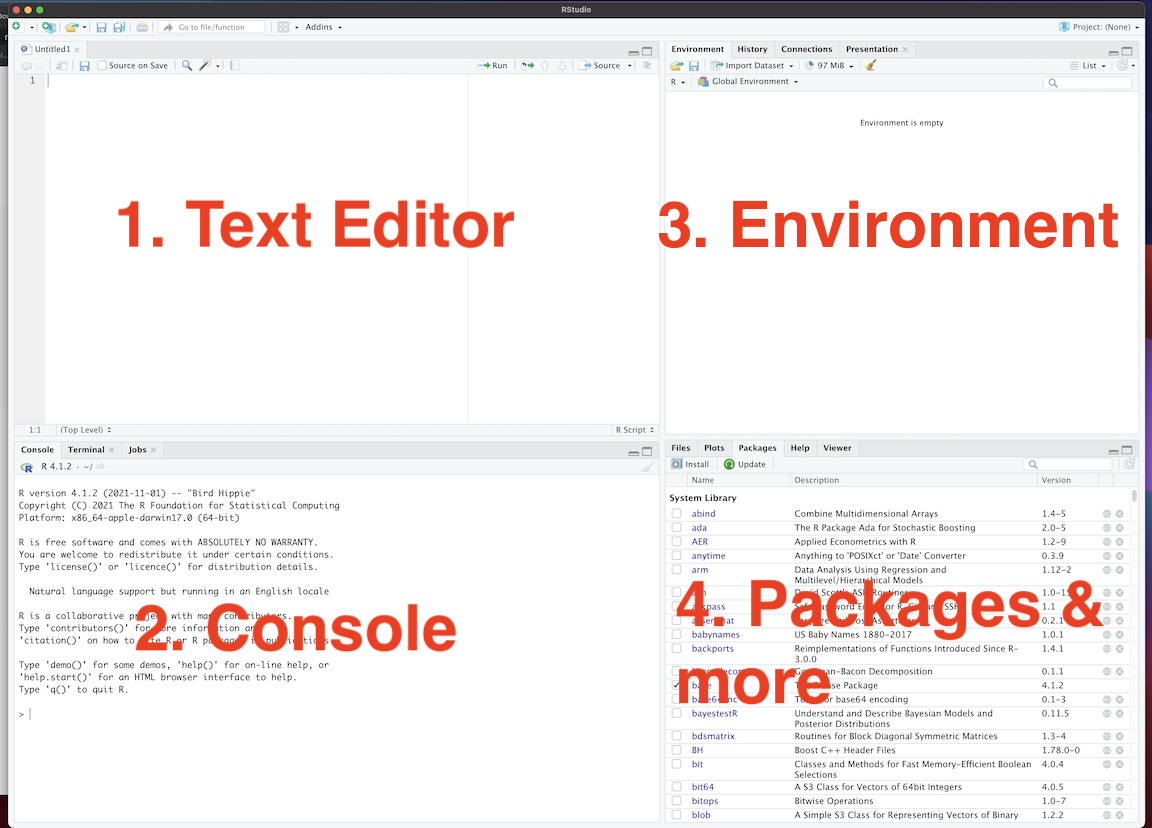
- Through R Studio
- An integrated development environment for R
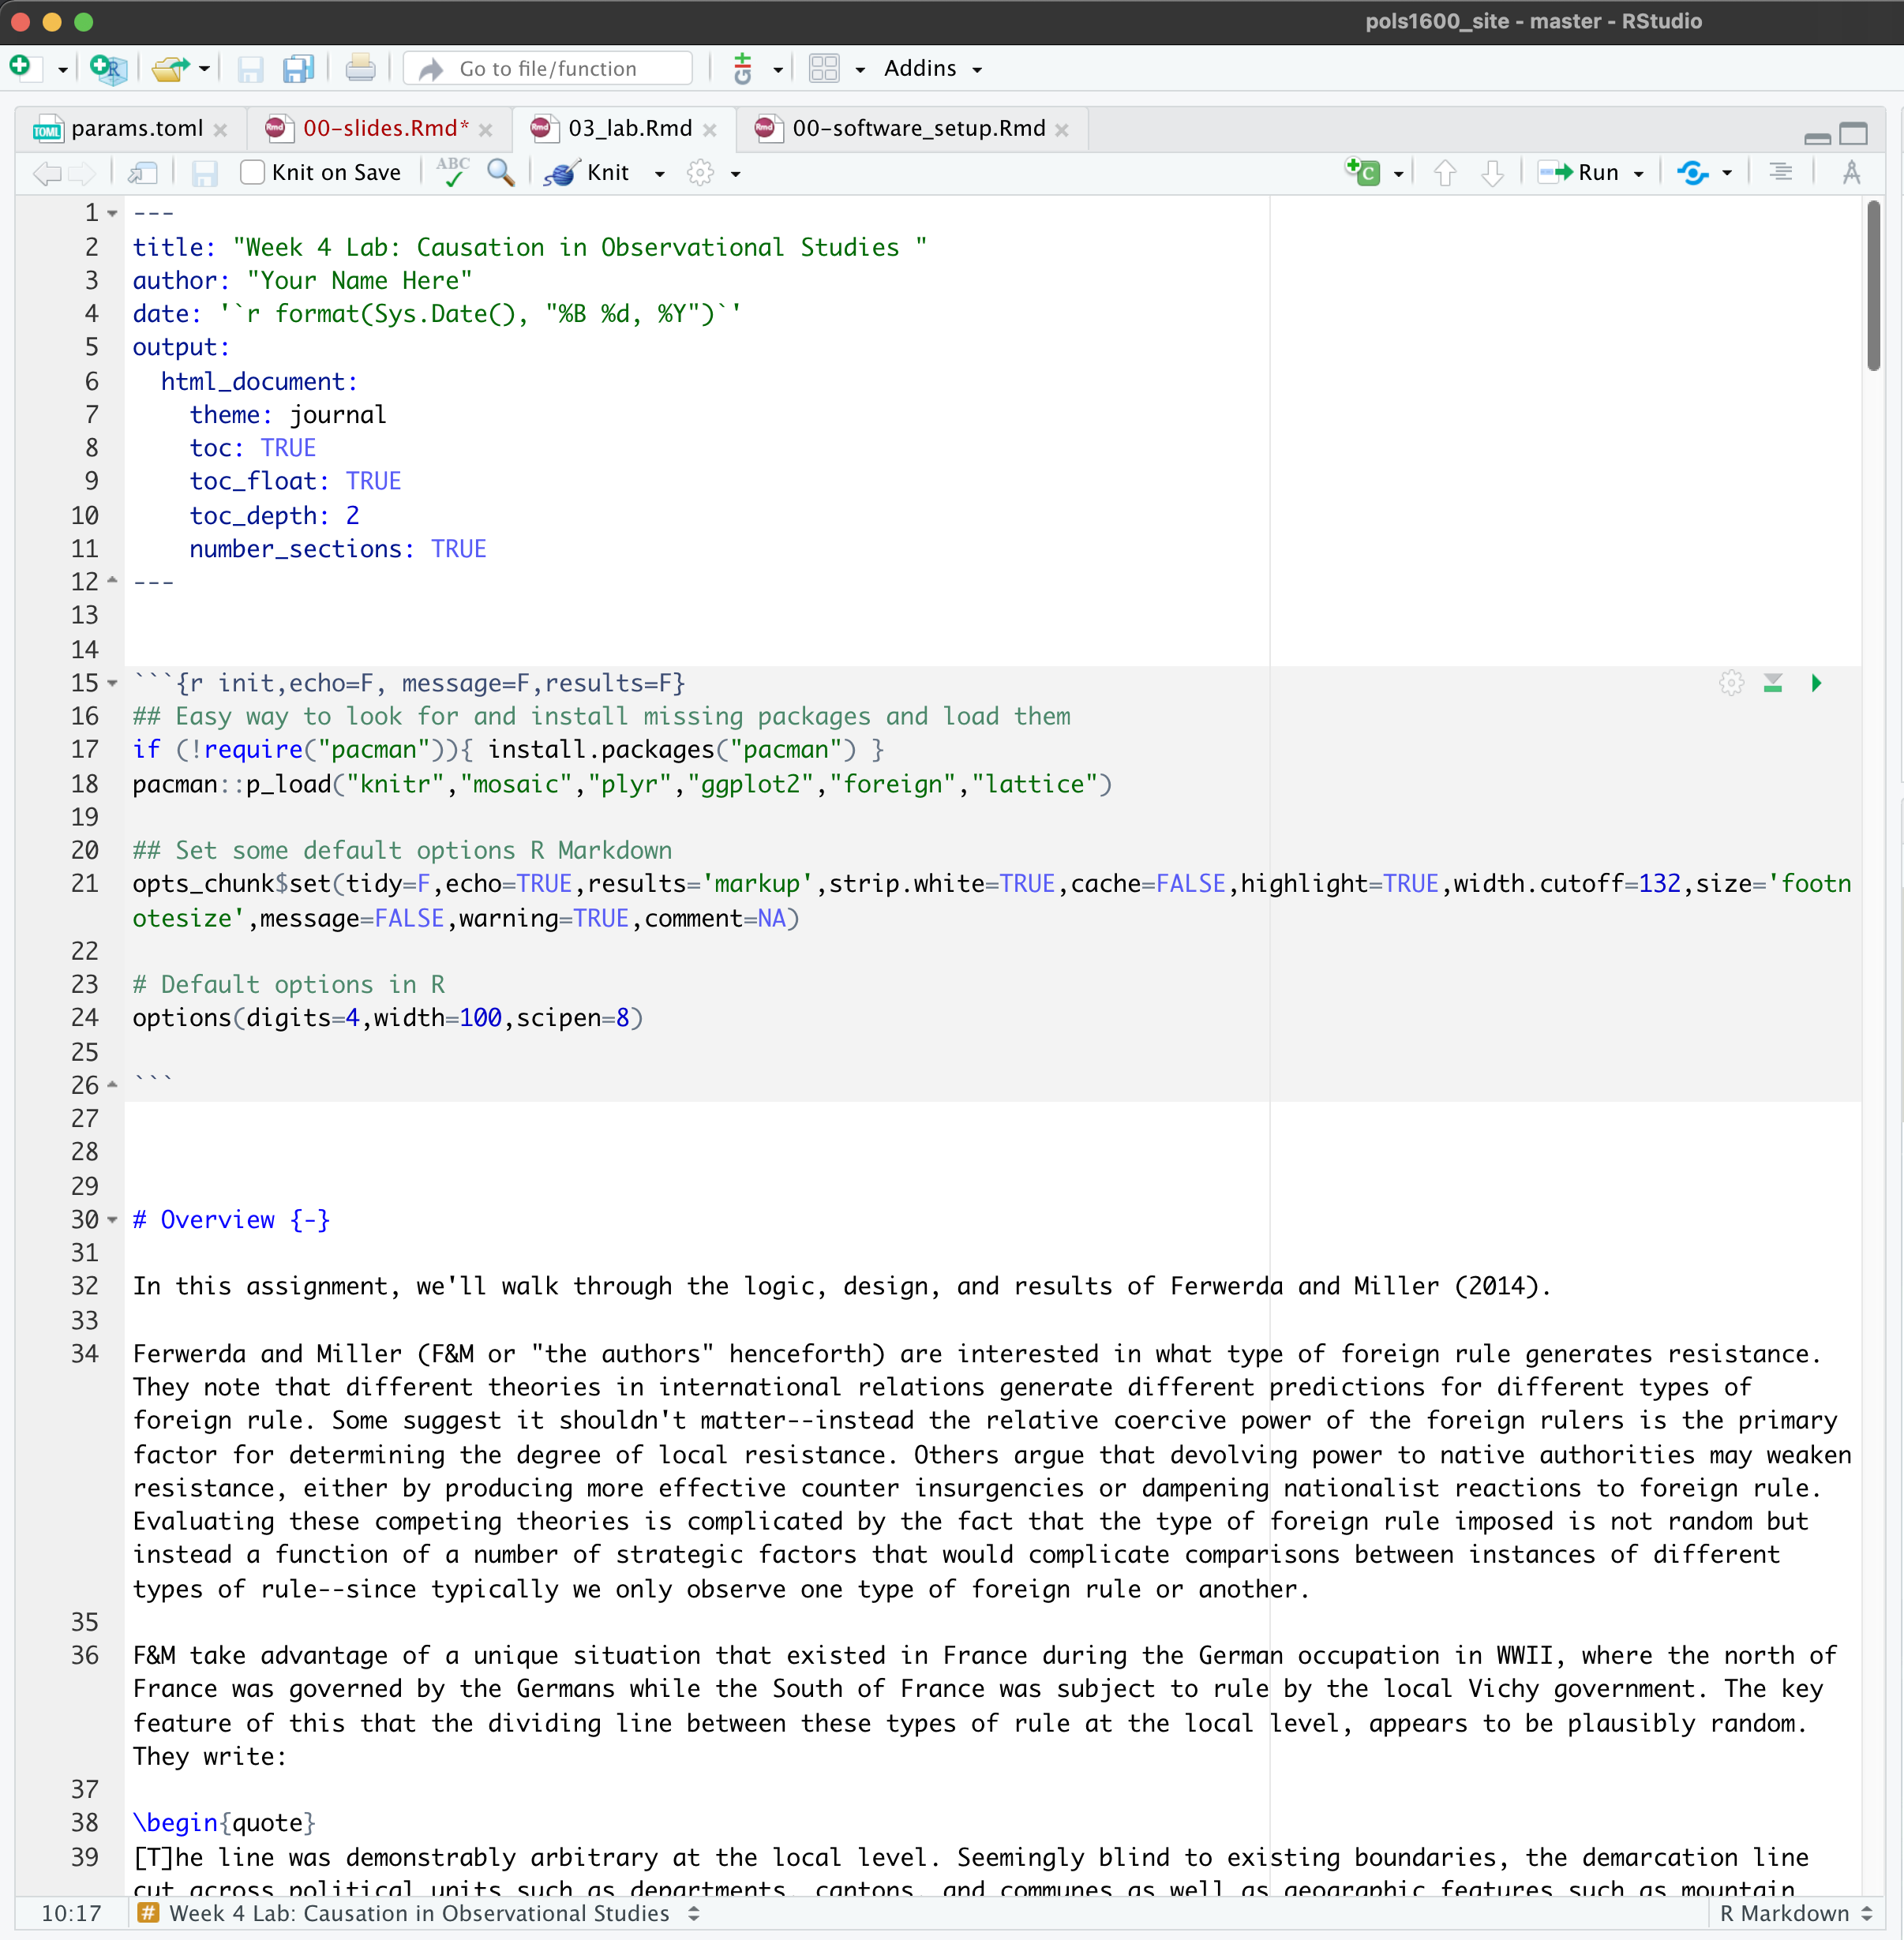
- Results written up using R Markdown
- Language for combing R code with html Markdown
R
R Studio
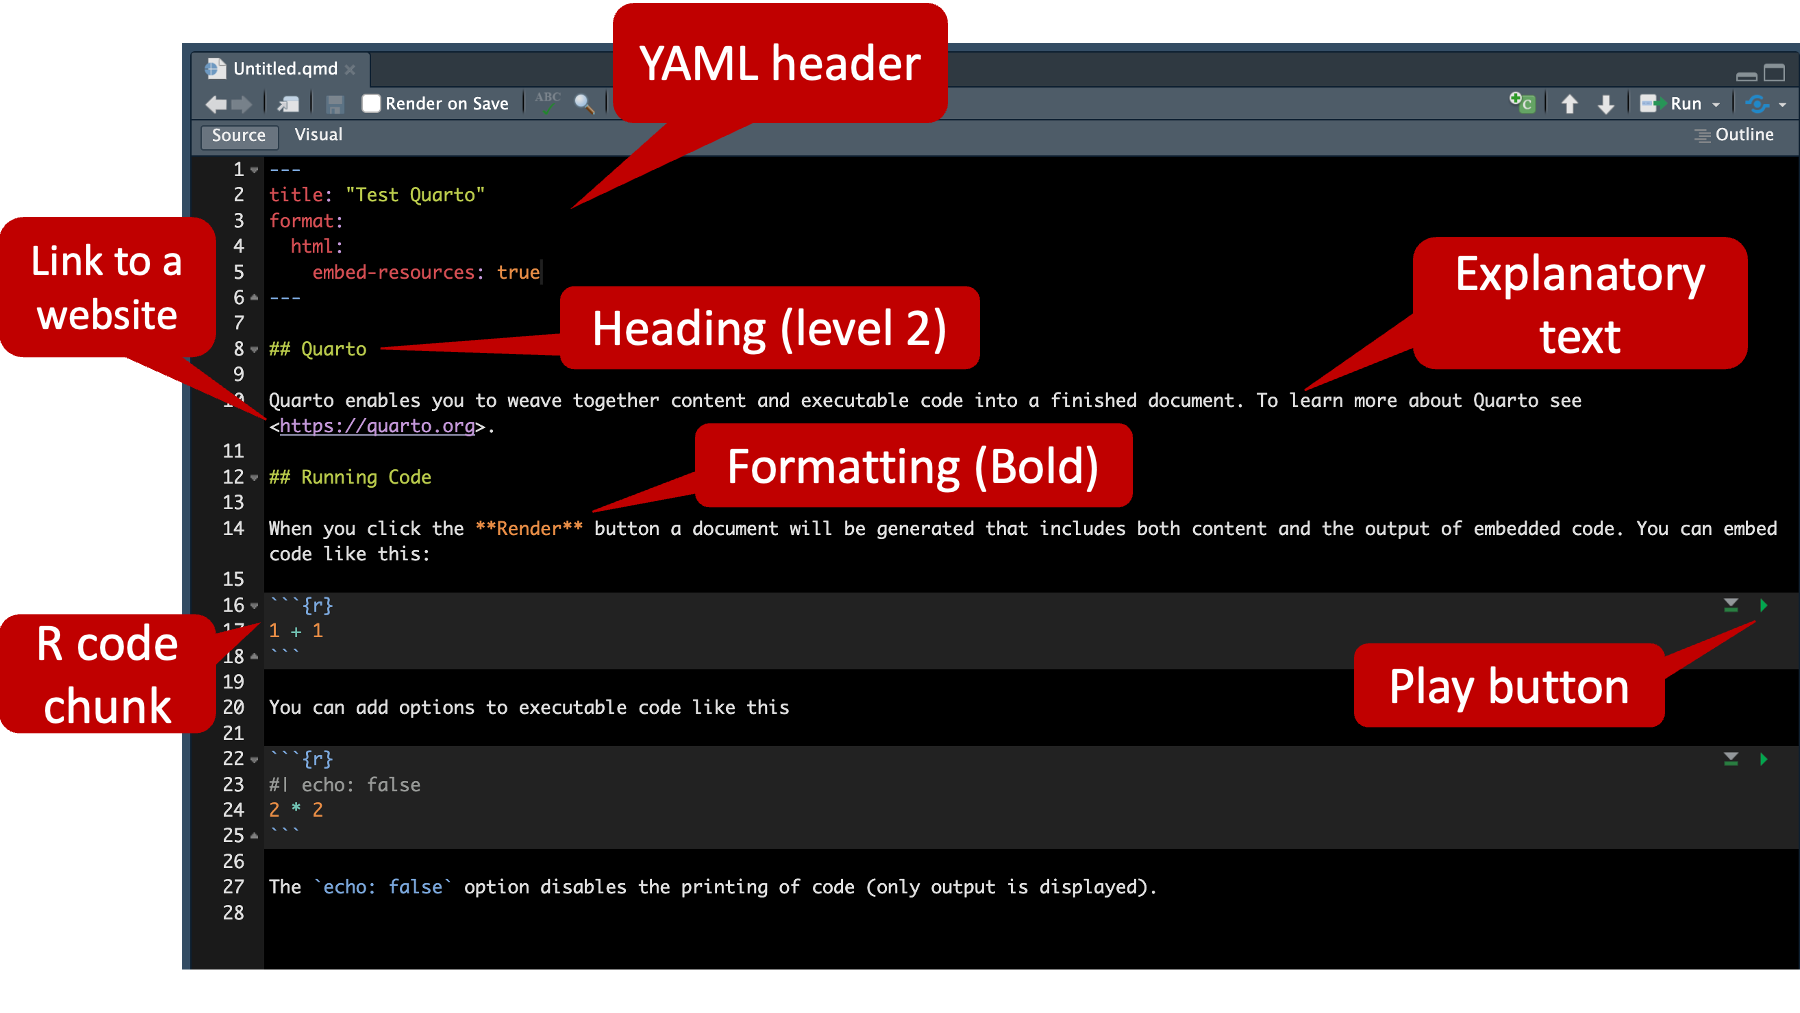
Quarto
- Project options in YAML
- Code in triple backtick chunks:
- Chunk options set with “#|” (hashpipe)
Write up in Markdown
Output rendered as an html file
Textbook

https://press.princeton.edu/books/paperback/9780691222288/quantitative-social-science
Labs

Labs
Grading

Grading

Grading

Grading
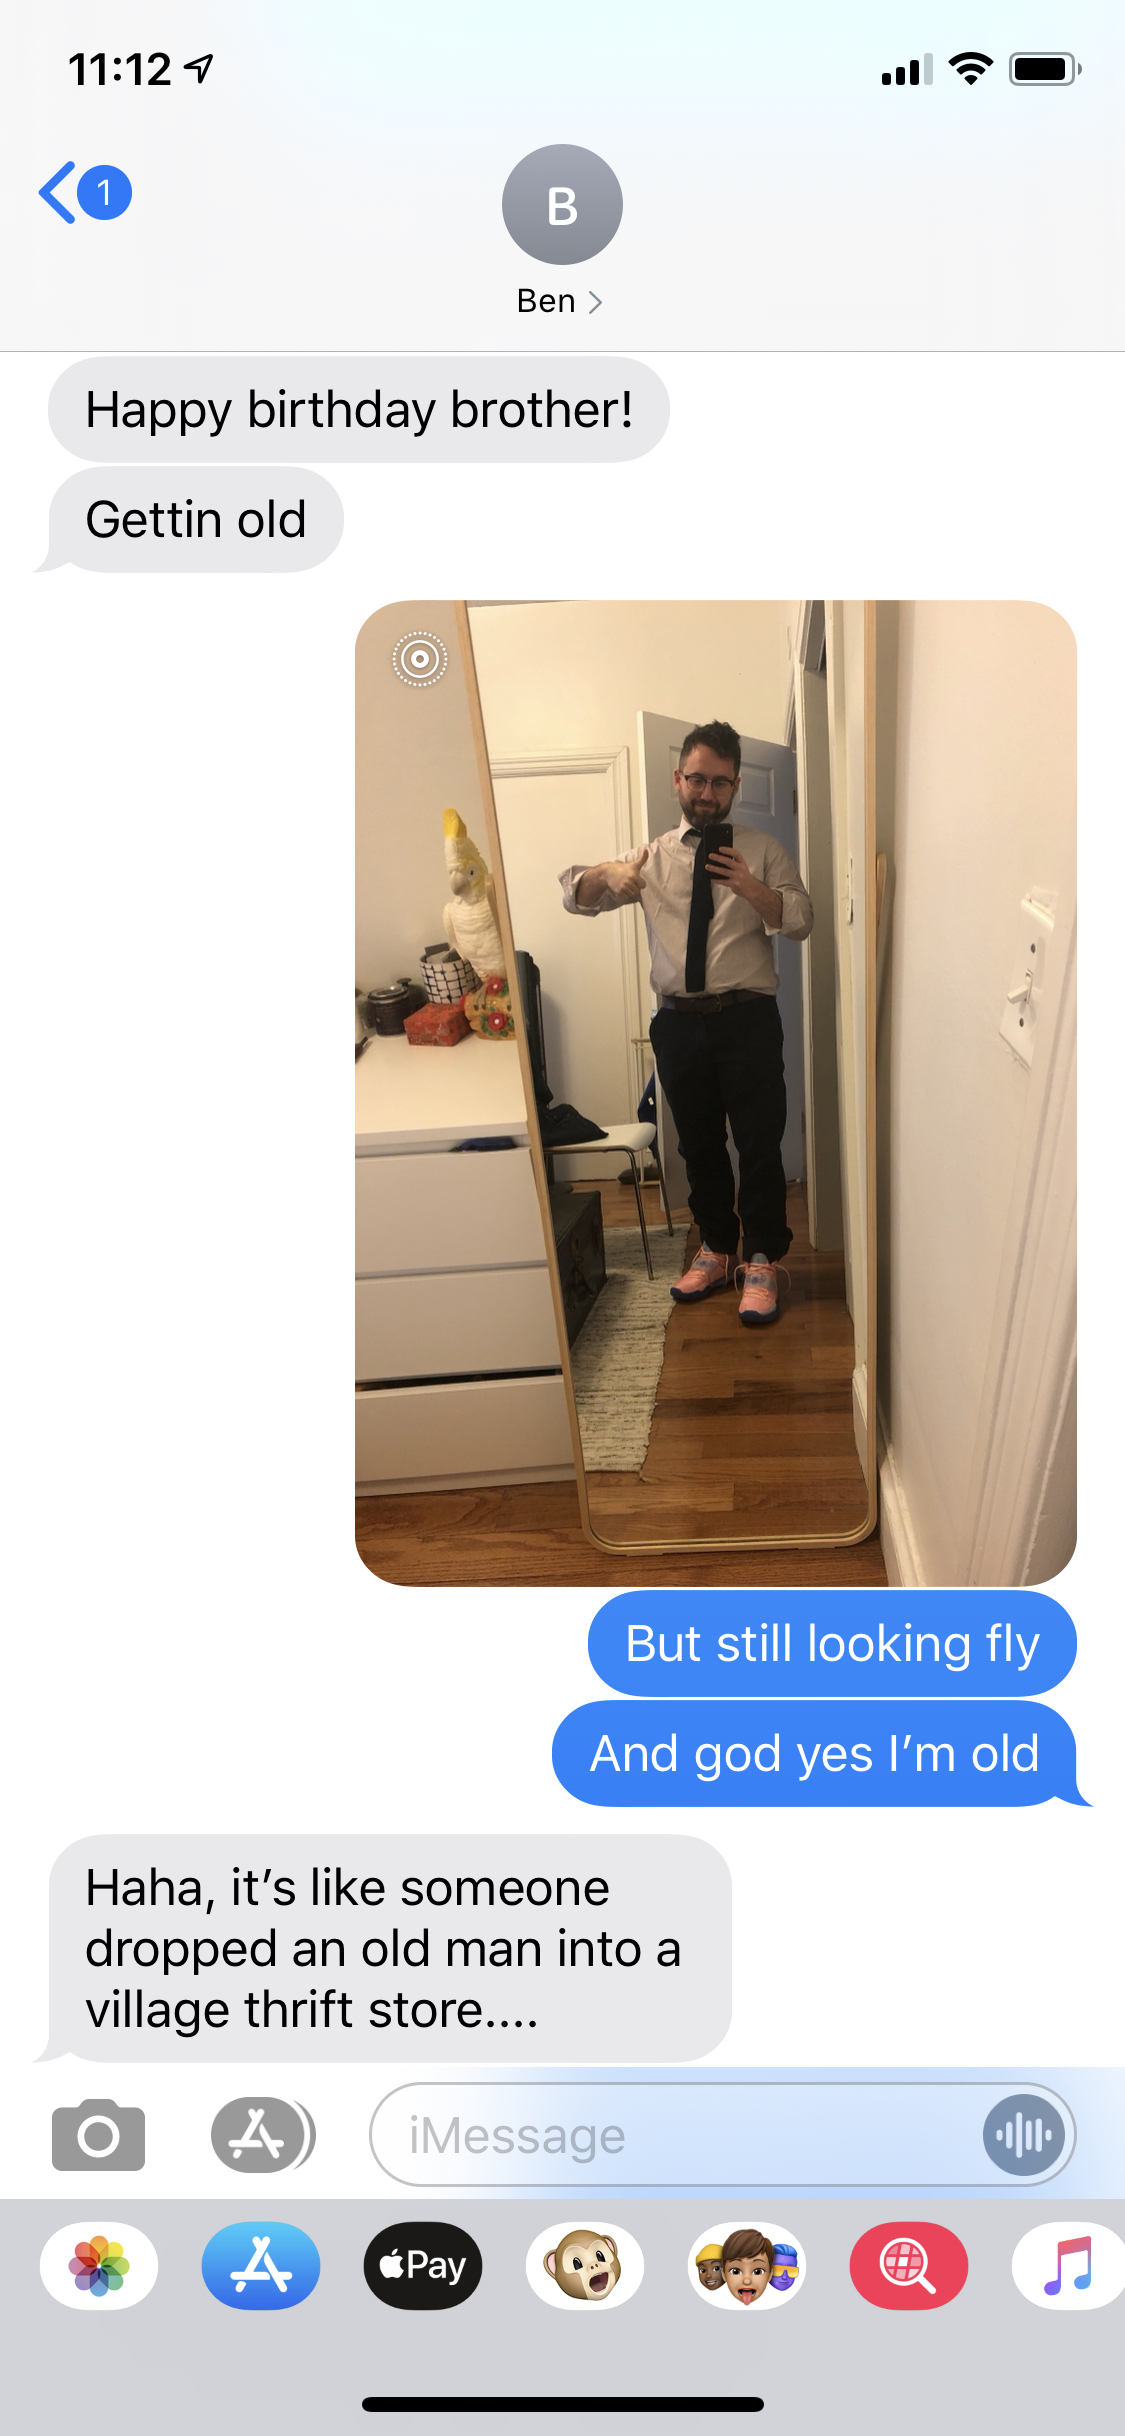
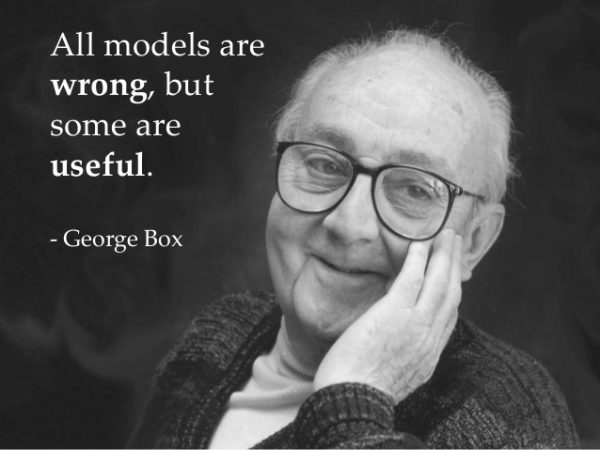
Testa’s first fundamental truth

1. Expectation Management

2. Pedagogical Tomfoolery
/cdn.vox-cdn.com/uploads/chorus_image/image/55701647/Screen_Shot_2017_07_13_at_1.09.20_PM.0.png)
3. Positionality
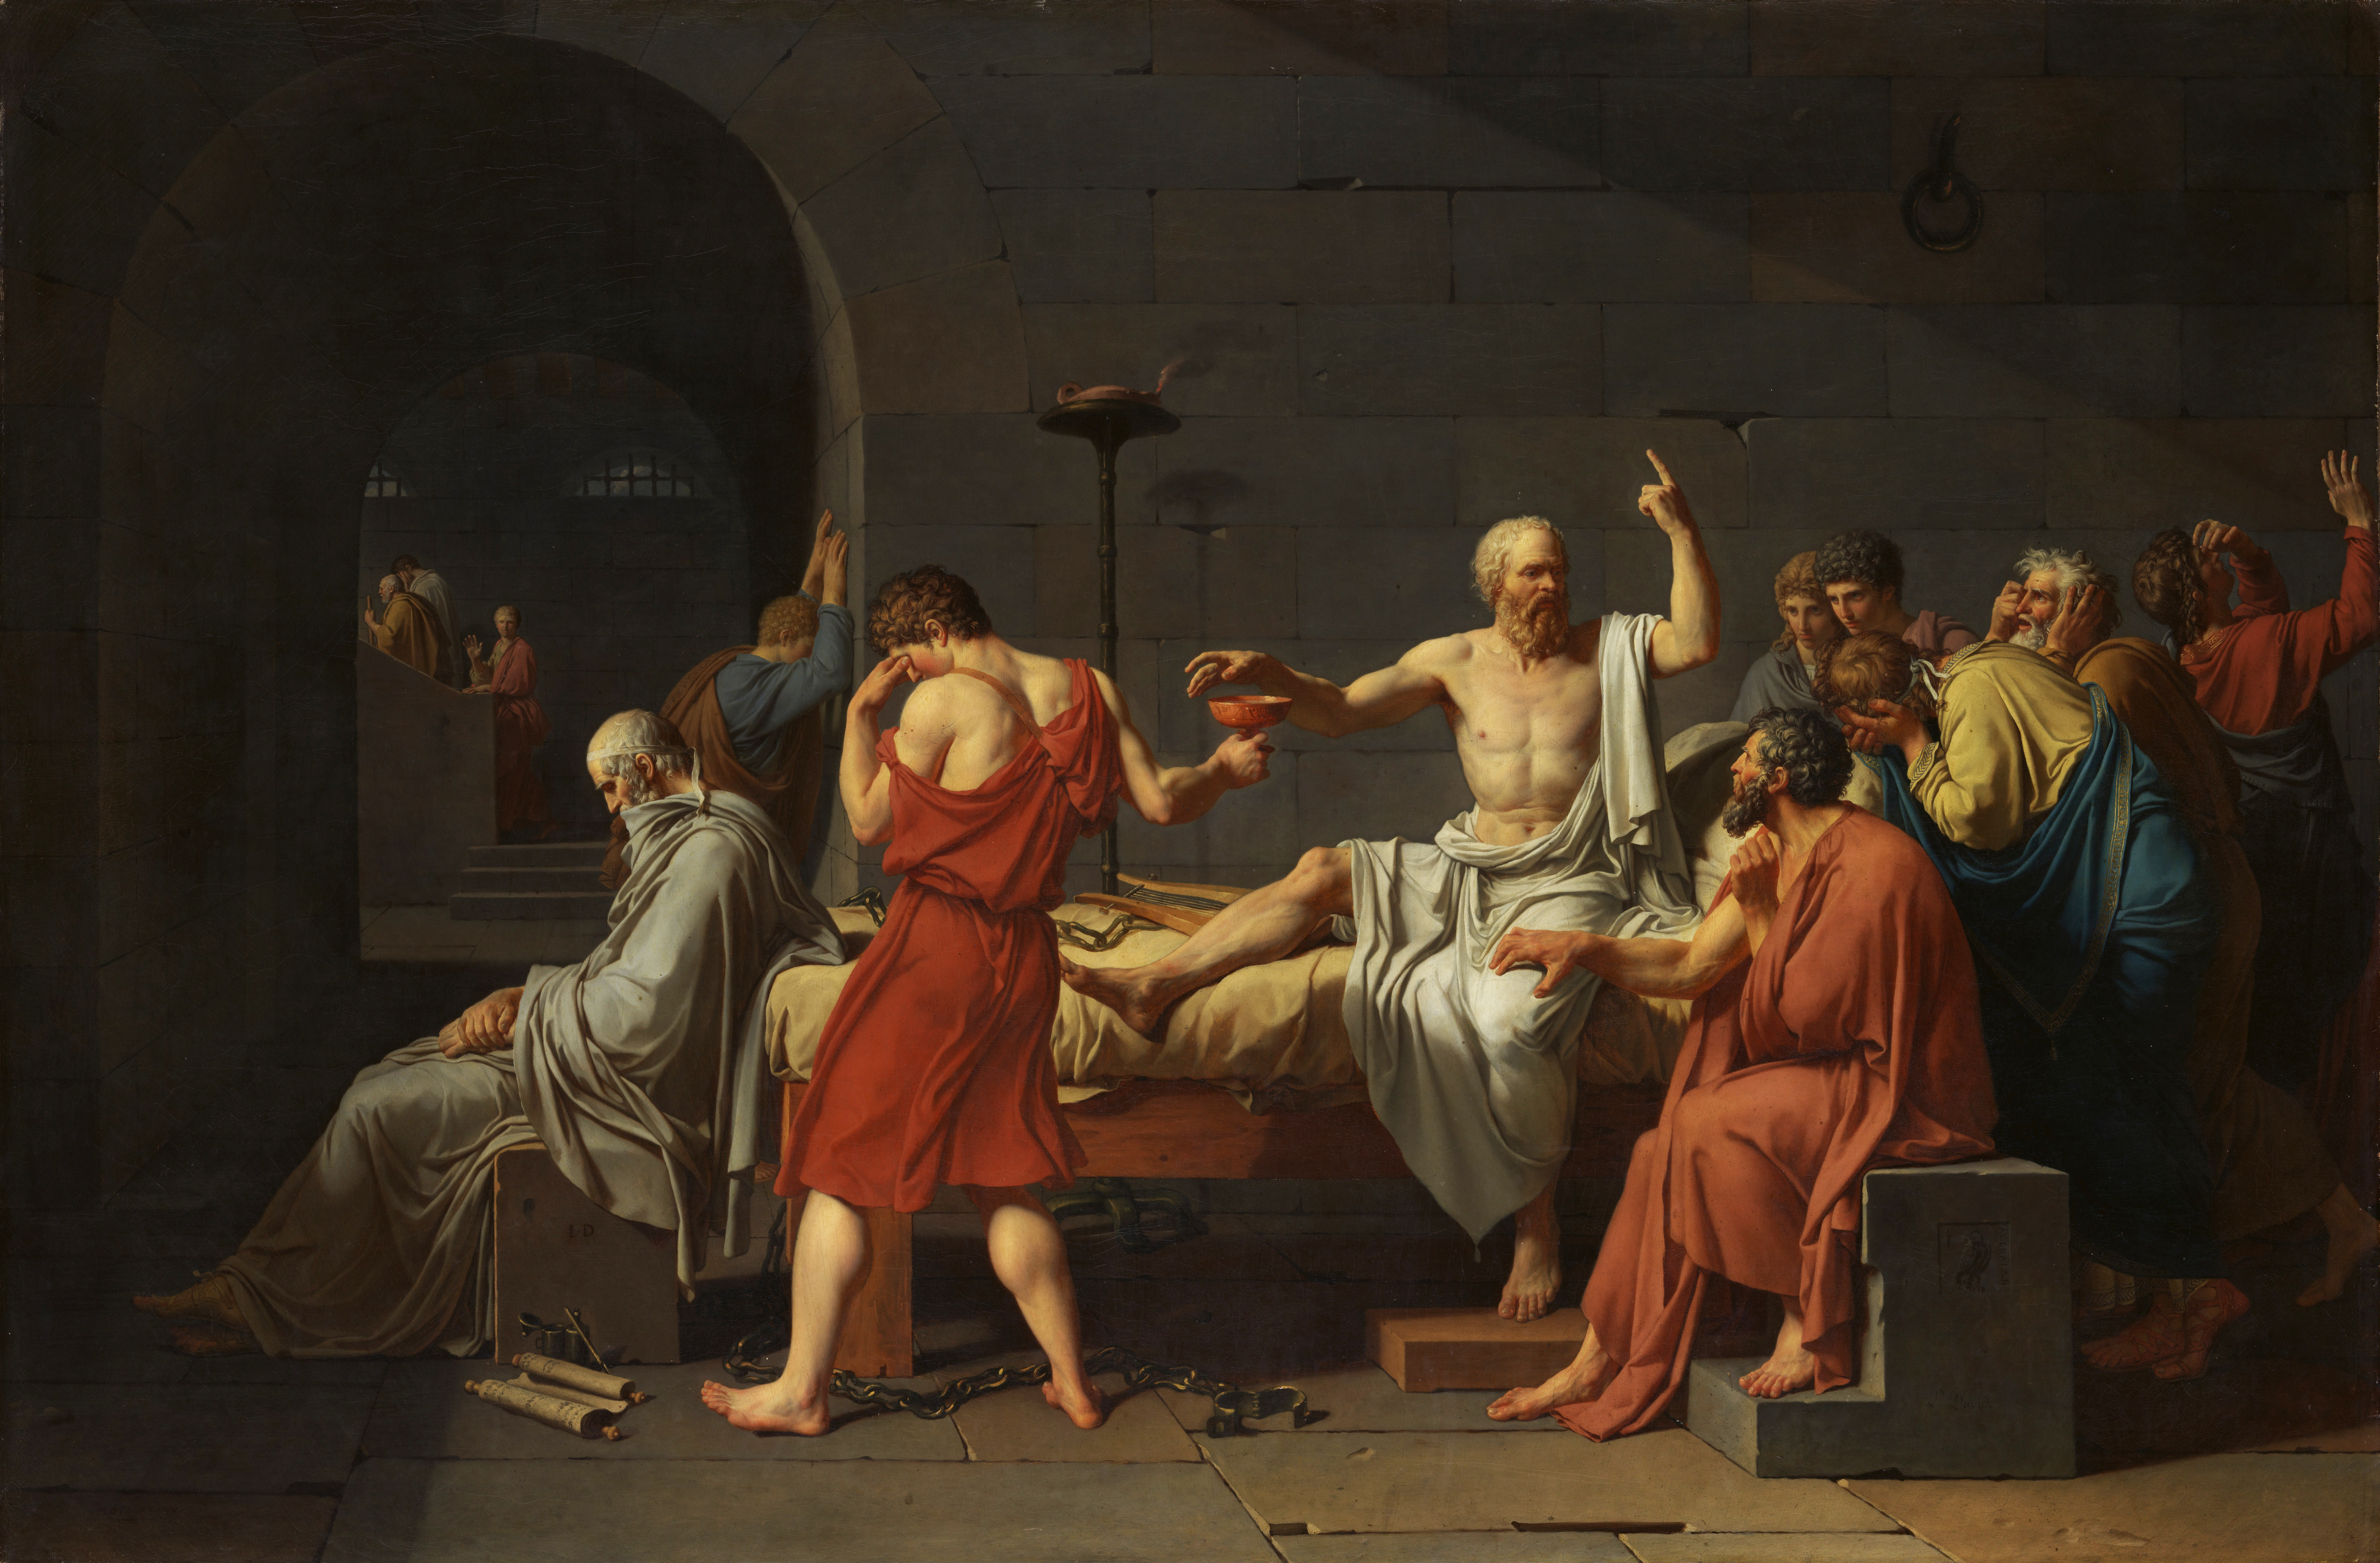
4. Epistemology

Testa’s second fundamental truth
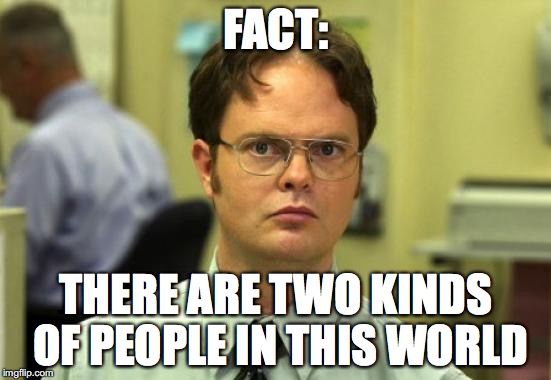
Two kinds of people in this world

What is it that we say we do here

Descriptions
Explanations
Explanations
Predictions and Uncertainty

Predictions and Uncertainty

Predictions and Uncertainty
Two kinds of people in this world
Introductions
But enough about me