POLS 1600

Interpreting and Evaluating
Linear Models

Updated Apr 22, 2025

Overview

Class Plan

  • Announcements (2-3 min)
  • Setup (2-3 min)
  • Feedback (15 min)
  • Topics:
    • What does it mean to control for X
    • How to make predictions with regression
    • Evaluating model fit
    • Difference-in-Differences
    • Set up for Lab 7

Goals

  • Regression models partition variation in an outcome into variation explained by the model and not explained by the model

  • Individual regression coefficients reflect the variation explained by that predictor, and only that predictor

  • Predicted values for regression models aid in substantive interpretation

  • Measures of model fit like R2 can be useful for comparing different regression models

  • Difference-in-differences designs combine pre-post and treatment-control comparisons to make stronger causal claims.

Annoucements

  • Assignment 1: Research Questions Feedback end of today
    • Feedback by class on Thursday
  • Assignment 2 Data: due Friday March 22

Setup: Packages for today

## Pacakges for today
the_packages <- c(
  ## R Markdown
  "kableExtra","DT","texreg","htmltools",
  ## Tidyverse
  "tidyverse", "lubridate", "forcats", "haven", "labelled",
  ## Extensions for ggplot
  "ggmap","ggrepel", "ggridges", "ggthemes", "ggpubr", 
  "GGally", "scales", "dagitty", "ggdag", "ggforce",
  # Data 
  "COVID19","maps","mapdata","qss","tidycensus", "dataverse", 
  # Analysis
  "DeclareDesign", "easystats", "zoo"
)

## Define a function to load (and if needed install) packages

ipak <- function(pkg){
    new.pkg <- pkg[!(pkg %in% installed.packages()[, "Package"])]
    if (length(new.pkg)) 
        install.packages(new.pkg, dependencies = TRUE)
    sapply(pkg, require, character.only = TRUE)
}

## Install (if needed) and load libraries in the_packages
ipak(the_packages)
   kableExtra            DT        texreg     htmltools     tidyverse 
         TRUE          TRUE          TRUE          TRUE          TRUE 
    lubridate       forcats         haven      labelled         ggmap 
         TRUE          TRUE          TRUE          TRUE          TRUE 
      ggrepel      ggridges      ggthemes        ggpubr        GGally 
         TRUE          TRUE          TRUE          TRUE          TRUE 
       scales       dagitty         ggdag       ggforce       COVID19 
         TRUE          TRUE          TRUE          TRUE          TRUE 
         maps       mapdata           qss    tidycensus     dataverse 
         TRUE          TRUE          TRUE          TRUE          TRUE 
DeclareDesign     easystats           zoo 
         TRUE          TRUE          TRUE 
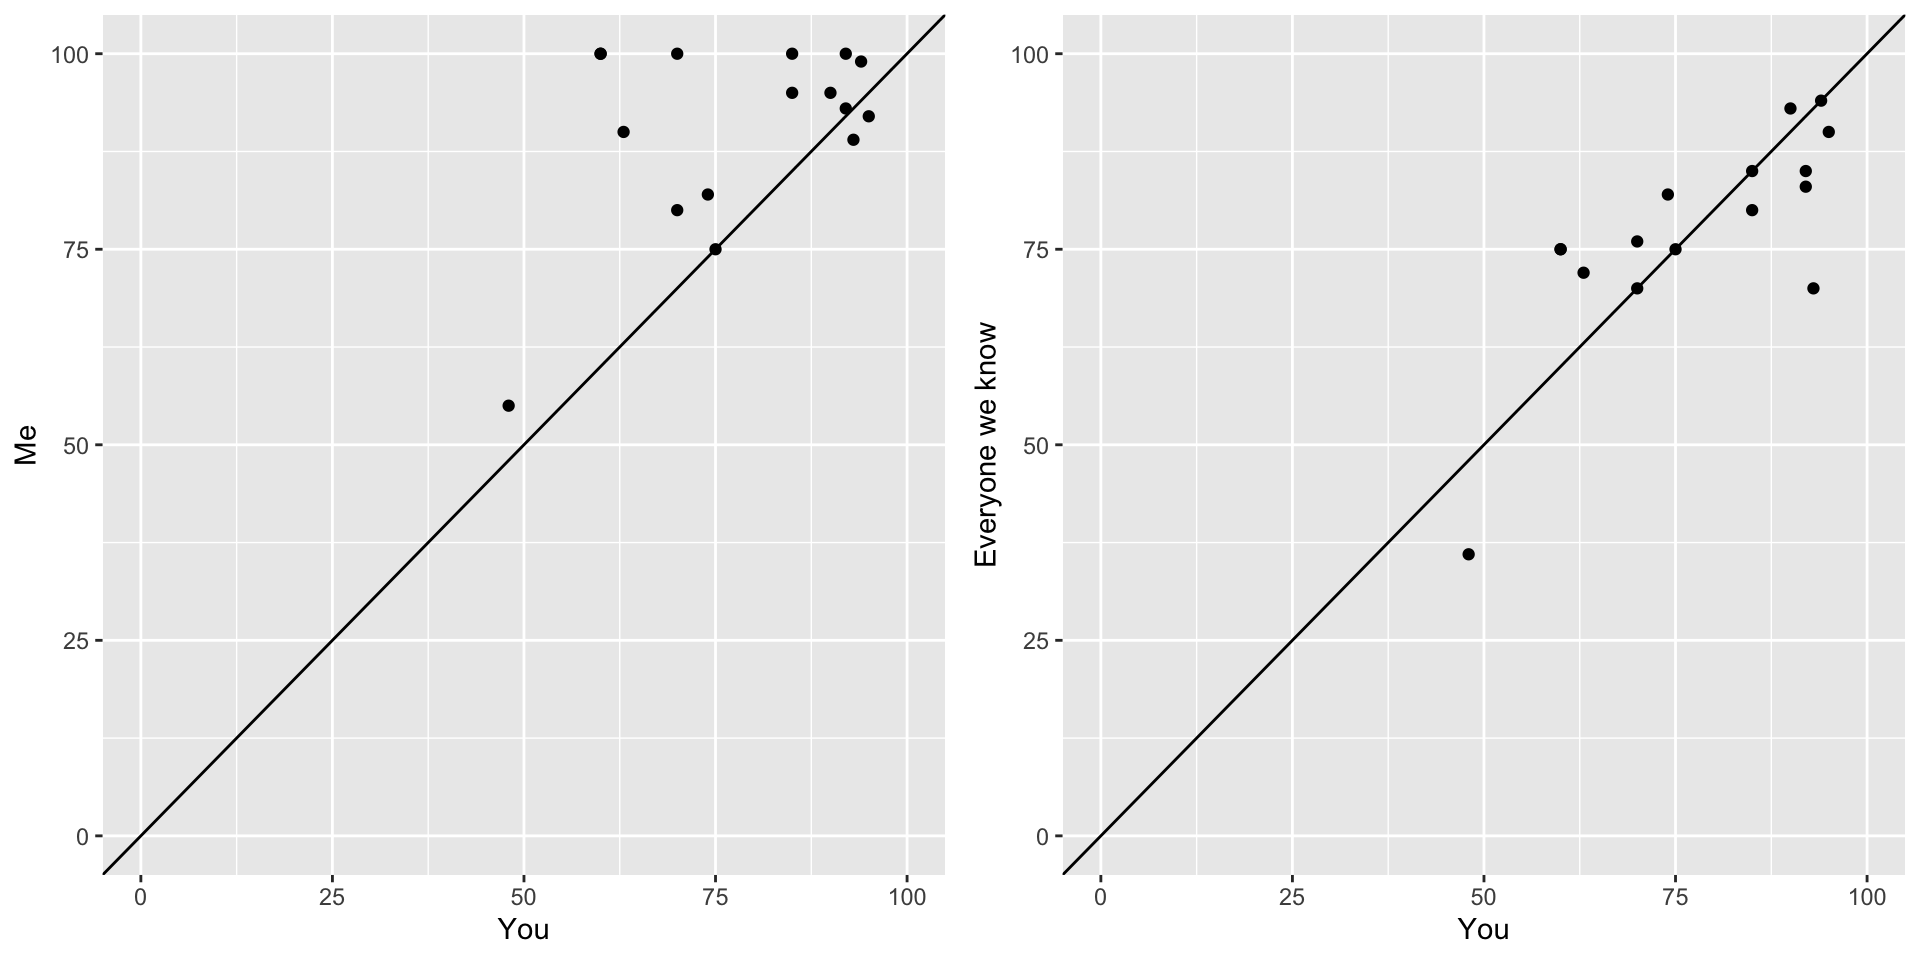
Feedback

What did we like


What did we dislike


What we’re good at


What we’re working on


How are we doing?

Don’t trust the polls

What should we do going forward?

  • From me:
    • Shorter labs
    • Shorter slides
    • More coding, less copy-pasting
  • From you?

What does it mean to “control for X”

Regression models partition variance

Regression models partition variance, separating the variation in the outcome into variation explained by the predictors in our model and the remaining variation not explained by these predictors

Total Variance=Variance Explained by Model+Unexplained VarianceObserved=Predicted Value+ErrorY=E[Y|X]+ϵY=Xβ^+ϵ^Y=Y^+ϵ^

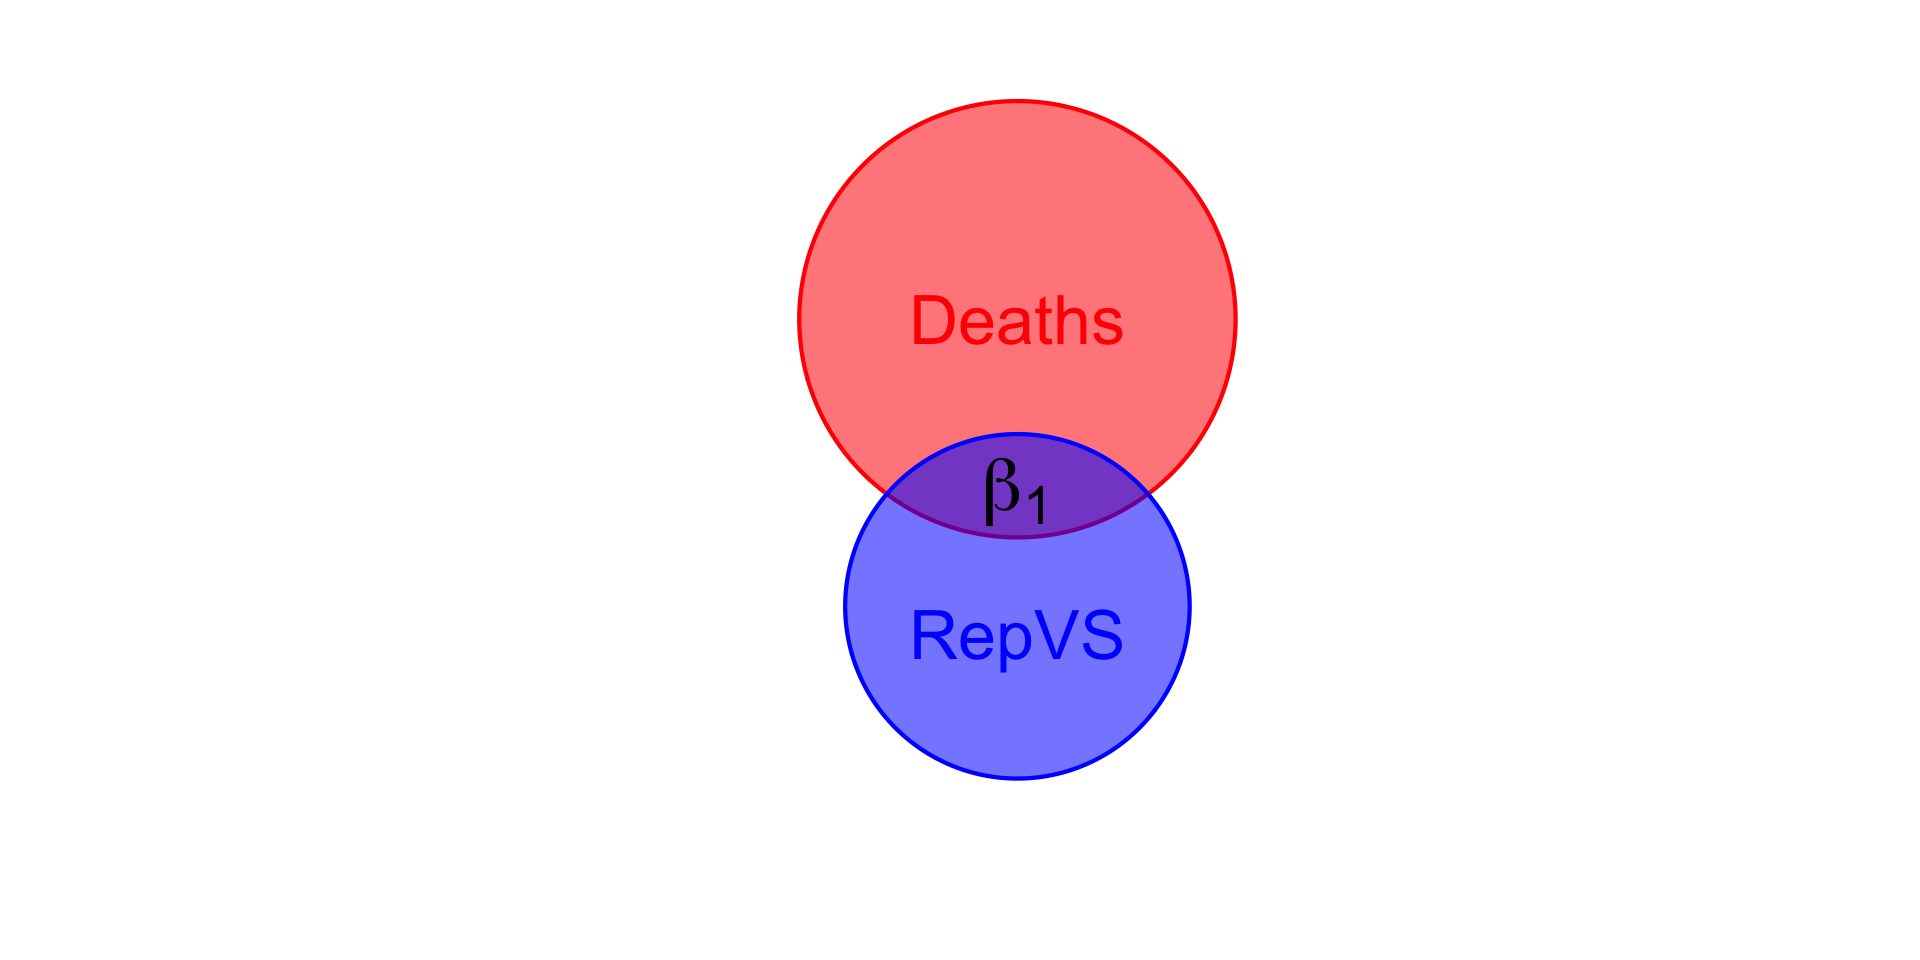
Coefficients describe the unique variance in Y explained by X (and only X)

  • Task

The coefficients in a regression model describe the variation in the outcome explained by that predictor, and only that predictor.

Let’s fit three models from last week’s lab and look at how the coefficients change from model to model

load(url("https://pols1600.paultesta.org/files/data/06_lab.rda"))
m1 <- lm(new_deaths_pc_14day ~ rep_voteshare_std, covid_lab)
m2 <- lm(new_deaths_pc_14day ~ rep_voteshare_std + med_age_std, covid_lab)
m3 <- lm(new_deaths_pc_14day ~ rep_voteshare_std + med_age_std + med_income_std, covid_lab)
htmlreg(list(m1, m2, m3)) %>% HTML() %>% browsable()
Statistical models
  Model 1 Model 2 Model 3
(Intercept) 0.57*** 0.57*** 0.57***
  (0.05) (0.05) (0.04)
rep_voteshare_std 0.23*** 0.23*** 0.07
  (0.05) (0.05) (0.07)
med_age_std   0.03 -0.02
    (0.05) (0.05)
med_income_std     -0.22**
      (0.07)
R2 0.31 0.31 0.44
Adj. R2 0.29 0.28 0.40
Num. obs. 51 51 51
***p < 0.001; **p < 0.01; *p < 0.05

Why do coefficients change when we control for variables?

Residualized Regression

Residualized regression is way of understanding what it means to control for variables in a regression.

Residualized regression provides a way of illustrating what we mean when say the coefficients describe the unique variance in Y explained by some predictor x (and only x)

What’s a residual

  • Residuals represent the part of the outcome variable, not explained by the predictors in a model
    • Difference between the observed y and the predicted y^

y=β0+β1x1+β2x2+…βjxj⏞Predictors+ϵ⏟Residuals

Residuals are uncorrelated with X and y^

Residuals are uncorrelated with (orthogonal to) the predictors X, and predicted values Xβ

# Trust but verify
cor(resid(m2),covid_lab$rep_voteshare_std) 
[1] 4.337636e-17
cor(resid(m2),covid_lab$med_age_std)
[1] 2.946319e-17
cor(resid(m2),fitted(m2))
[1] -7.506391e-17

Residualized Regression

  • m2
  • m3

For a model like m2 we can recover the coefficient on rep_voteshare_std by:

  1. Regressing new_deaths_pc_14day on med_age_std to get the residual variation in Covid-19 deaths not explained by median age
  2. Regressing rep_voteshare_std on med_age_std to get the residual variation in Republican Vote Share not explained by median age
  3. Regressing the residuals from 1. (Deaths not explained by age) on the residuals from 2. (Vote share not explained by age) to obtain the same coefficient from m2 for rep_voteshare_std

The same principle holds for m3

# 1. Regressing `new_deaths_pc_14da` on `med_age_std`
m2_death_by_age <- lm(new_deaths_pc_14day ~ med_age_std, covid_lab)
# Save residuals
covid_lab$res_death_no_age <- resid(m2_death_by_age)

# 2. Regressing `rep_voteshare_std` on `med_age_std` 
m2_repvs_by_age <- lm(rep_voteshare_std ~ med_age_std, covid_lab)
# Save residuals
covid_lab$res_repvs_no_age <- resid(m2_repvs_by_age)

# 3. Residualized regression of deaths on Rep Vote Share
m2_res <- lm(res_death_no_age ~ res_repvs_no_age, covid_lab)

# Mutliple regression
coef(m2)[2]
rep_voteshare_std 
         0.230745 
# Residualized regression
coef(m2_res)[2]
res_repvs_no_age 
        0.230745 
# 1. Regressing `new_deaths_pc_14da` on `med_age_std` and med_income_std
m3_death_by_age_income <- lm(new_deaths_pc_14day ~ med_age_std + med_income_std, covid_lab)
# Save residuals
covid_lab$res_death_no_age_income <- resid(m3_death_by_age_income)

# 2. Regressing `rep_voteshare_std` on `med_age_std` and med_income_std
m3_repvs_by_age_income <- lm(rep_voteshare_std ~ med_age_std + med_income_std, covid_lab)
# Save residuals
covid_lab$res_repvs_no_age_income <- resid(m3_repvs_by_age_income)

# 3. Residualized regression of deaths on Rep Vote Share
m3_res <- lm(res_death_no_age_income ~ res_repvs_no_age_income, covid_lab)

# multiple regression coefficient
coef(m3)[2]
rep_voteshare_std 
       0.07140446 
# Same as  residualized regression coefficient
coef(m3_res)[2]
res_repvs_no_age_income 
             0.07140446 

Why did the coefficient on Rep Vote Share change in m3 but not m2?

Statistical models
  DV: Death
  Baseline
(Intercept) 0.57***
  (0.05)
rep_voteshare_std 0.23***
  (0.05)
R2 0.31
Adj. R2 0.29
Num. obs. 51
***p < 0.001; **p < 0.01; *p < 0.05

Covid-19 Deaths=β0+β1Rep Vote Share

Statistical models
  DV: Death DV: Vote Share DV: Res. Deaths
  Baseline Mutliple Age Vote Share Deaths
(Intercept) 0.57*** 0.57*** 0.57*** -0.00 -0.00
  (0.05) (0.05) (0.06) (0.14) (0.05)
rep_voteshare_std 0.23*** 0.23***      
  (0.05) (0.05)      
med_age_std   0.03 0.00 -0.12  
    (0.05) (0.06) (0.14)  
res_repvs_no_age         0.23***
          (0.05)
R2 0.31 0.31 0.00 0.02 0.31
Adj. R2 0.29 0.28 -0.02 -0.00 0.30
Num. obs. 51 51 51 51 51
***p < 0.001; **p < 0.01; *p < 0.05

Deaths=β0+β1Rep VS+β2Age

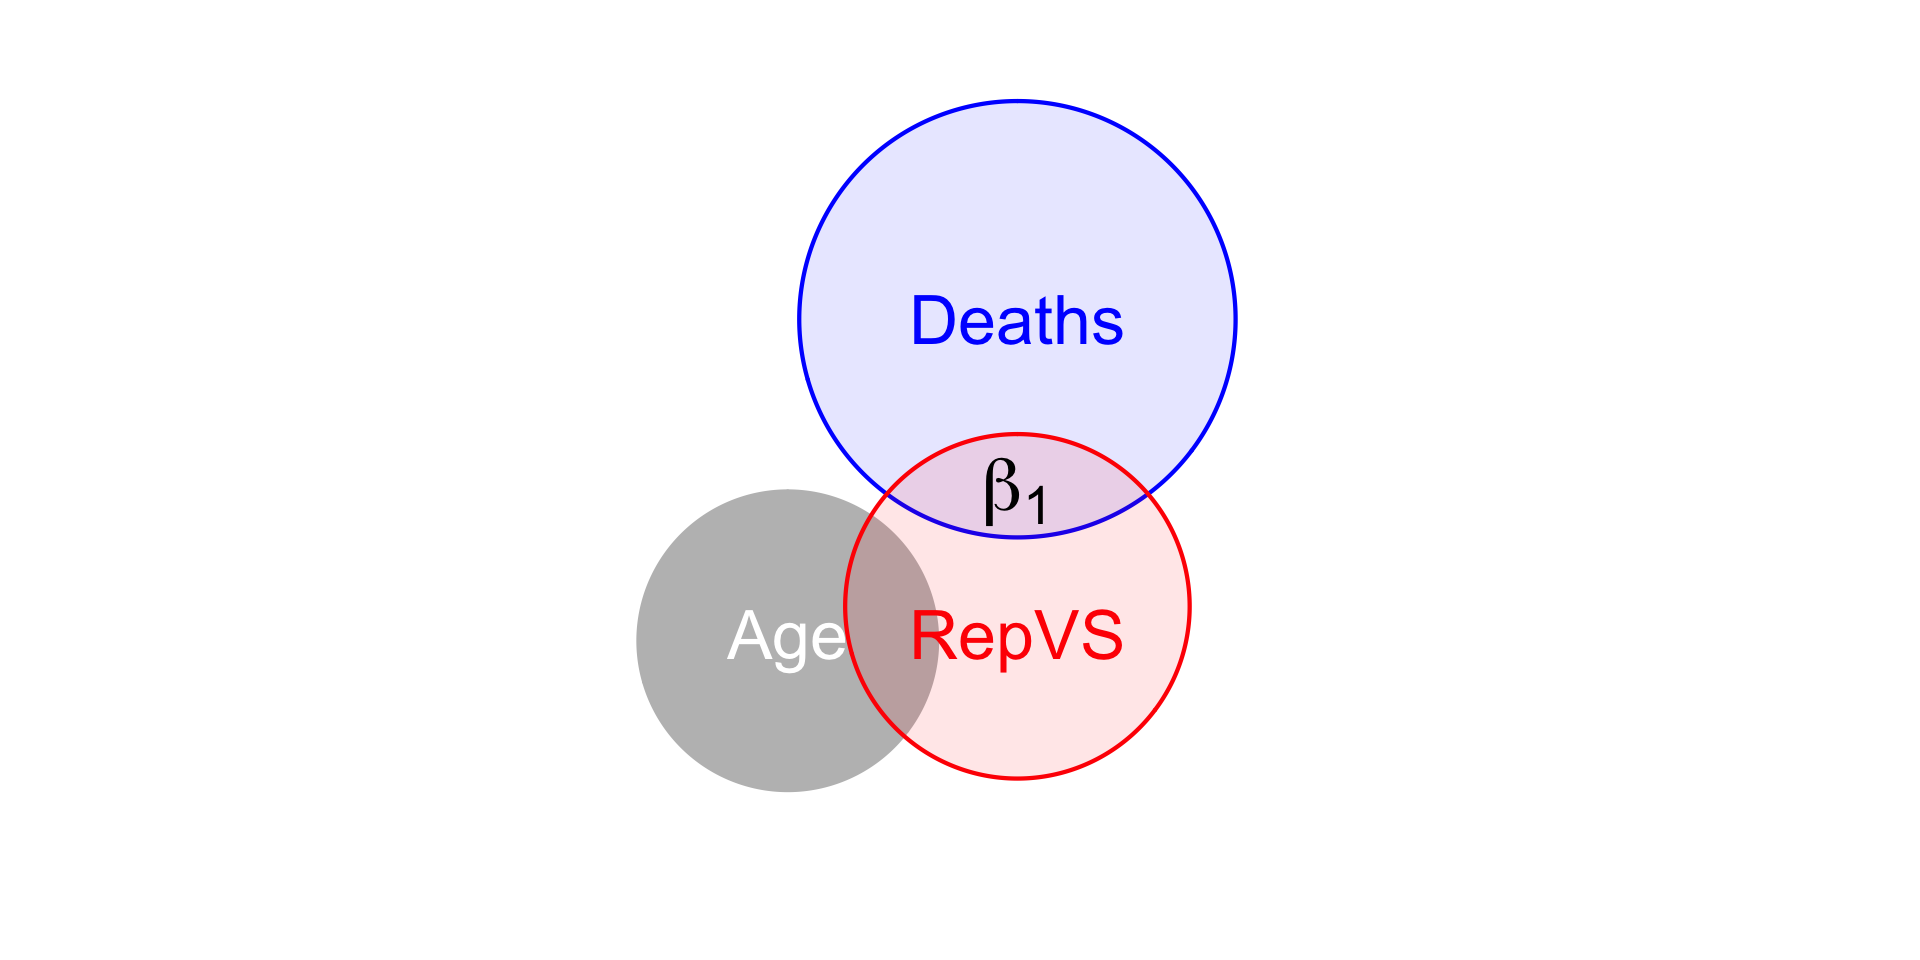
β1 doesn’t change because age has no relationship to deaths in these data

Statistical models
  DV: Death DV: Vote Share DV: Res. Death
  Baseline Full No Rep Vote Share Deaths
(Intercept) 0.57*** 0.57*** 0.57*** -0.00 0.00
  (0.05) (0.04) (0.04) (0.10) (0.04)
rep_voteshare_std 0.23*** 0.07      
  (0.05) (0.07)      
med_age_std   -0.02 -0.03 -0.22*  
    (0.05) (0.05) (0.10)  
med_income_std   -0.22** -0.27*** -0.74***  
    (0.07) (0.05) (0.10)  
res_repvs_no_age_income         0.07
          (0.07)
R2 0.31 0.44 0.43 0.55 0.02
Adj. R2 0.29 0.40 0.40 0.53 0.00
Num. obs. 51 51 51 51 51
***p < 0.001; **p < 0.01; *p < 0.05

Deaths=β0+β1Rep VS+β2Age+β3Income

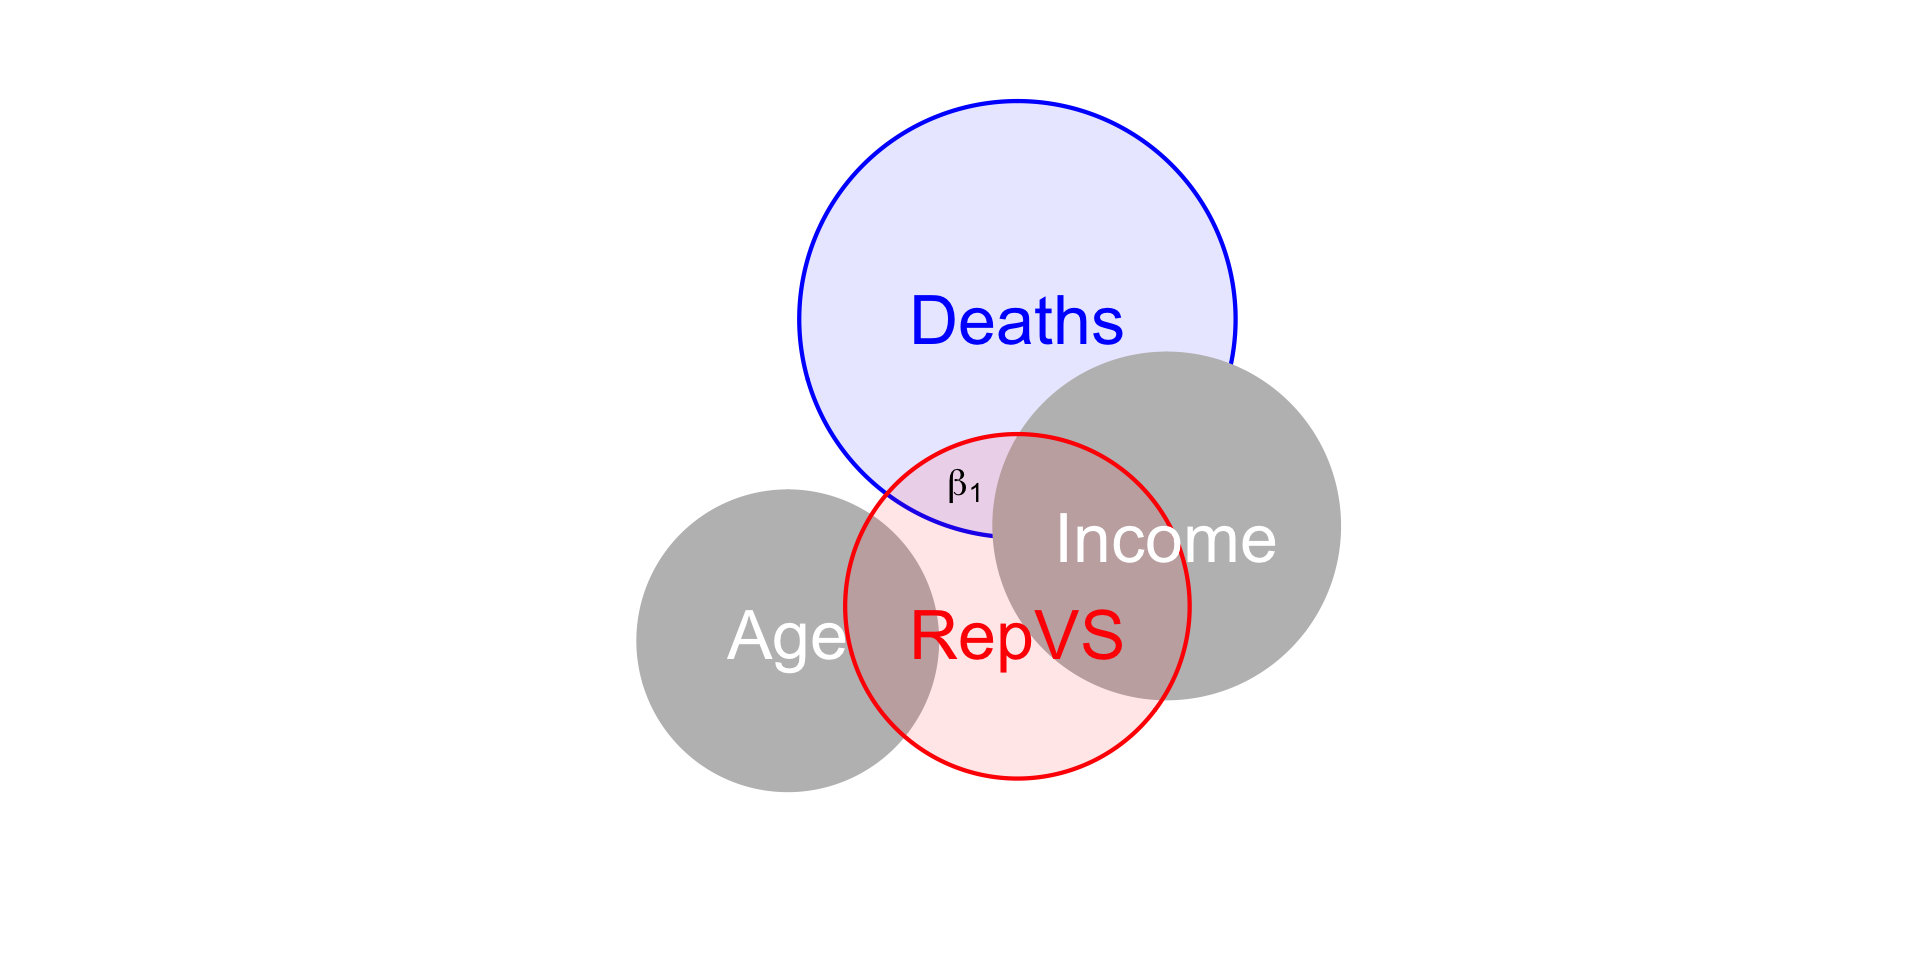
β1 decreases because after controlling for income there is less unique variation explained only by republican vote share

Using regression to make predictions

Using regression to produce predicted values

Coefficients in a regression define a formula which produces a predicted value of the outcome y when the predictors X take particular values.

y=β0+β1x1+β2x2+…βjxj⏞Predictors+ϵ⏟Residualsy=β0+β1xrvs+β2xage+β3xinc+ϵm3y=0.56+0.07xrvs−0.02xage−0.22xinc+ϵ^estimated m3y=0.56+0.07(−0.87)−0.02(0.62)−0.22(0.38)+ϵ^prediction for RI0.22⏞Observed=0.41⏟Predicted+(−0.19)⏞Residual

Producing Predicted Values in R

The basic steps to producing predicted values in R as follows:

  • Fit a model using lm()
  • Create a prediction data frame using expand_grid():
    • vary the values of the predictor you’re interested in
    • hold all the other predictors in your model constant at some typical value.
  • Input the model from lm() and the prediction data frame, into the predict() function to obtain predicted values.
    • Save predictions as a new column in your prediction data frame (I generally call them fit)
  • Plot predicted values in your prediction data frame to help interpret your model

Are there decreasing returns to vaccination?

  • Task
  • m4
  • Table
  • Predict
  • Fig

Suppose we thought the marginal effect – (here, predicted change in deaths from a 1 percent increase in the percent of the population vaccinated) of vaccines varied.

There might be large gains from going to low to average rates of vaccination, but after a certain threshold, the decreases in deaths would taper off.

We could test this by including a polynomial term I(percent_vaccinated)^2 in our model.

Including a polynomial term, allows the marginal effect to vary, based on the value of the predictor.

It’s hard to interpret the coefficients on polynomial terms (or interaction terms) just by looking at coefficients in a table

Instead, we’ll produce a plot of predicted values to test these claims

m4 <- lm(new_deaths_pc_14day ~ percent_vaccinated + I(percent_vaccinated^2) + rep_voteshare_std + med_age_std + med_income_std, covid_lab
           )
Statistical models
  Model 1
(Intercept) 6.194**
  (2.186)
percent_vaccinated -0.169*
  (0.077)
percent_vaccinated^2 0.001
  (0.001)
rep_voteshare_std -0.062
  (0.081)
med_age_std 0.053
  (0.053)
med_income_std -0.114
  (0.068)
R2 0.561
Adj. R2 0.512
Num. obs. 51
***p < 0.001; **p < 0.01; *p < 0.05
pred_df <- expand_grid(
  percent_vaccinated = sort(unique(covid_lab$percent_vaccinated)),
  # Set standardized predictors to their means of 0
  rep_voteshare_std = 0,
  med_age_std = 0,
  med_income_std = 0
)

pred_df$fit <- predict(m4, newdata = pred_df)

pred_df %>% 
  ggplot(aes(percent_vaccinated, fit))+
  geom_line()+
  labs(
    y = "Predicted Covid-19 Deaths\n(per capita, 14-day average)",
    x = "Percent of State's population that's Vaccinated"
  ) + 
  theme_minimal() -> fig_m4

For a typical state, early increases in vaccination rate are associated with larger declines in predicted deaths from Covid-19

Evaluating Model Fit

Evaluating Model Fit

Models partition variance. We can summarize the overall fit of our model using measures like R2

R2=variance(predicted values )variance(observed values )

R^2

More formally, you’ll see R2 defined in terms of “Sums of Squares”

  • TSS = Total Sum of Squares = Variance of the Outcome
  • ESS = Explained Sum of Squares = Variance of the Predicted Values
  • RSS = Sum of Squared Residuals = Variance of the Residuals

R2=ESSTSS=1−RSSTSS

Calculating R2 in R

We could do it by hand, finding that our model explained about 43 percent of the observed variation deaths.

# ESS / TSS
var(m3$fitted.values)/var(m3$model$new_deaths_pc_14day)
[1] 0.4393655
# 1 - RSS/TSS
1 - var(m3$residuals)/var(m3$model$new_deaths_pc_14day)
[1] 0.4393655

But generally we let the summary() function do it for us:

summary(m3)

Call:
lm(formula = new_deaths_pc_14day ~ rep_voteshare_std + med_age_std + 
    med_income_std, data = covid_lab)

Residuals:
     Min       1Q   Median       3Q      Max 
-0.50751 -0.19703 -0.06278  0.20024  0.92320 

Coefficients:
                  Estimate Std. Error t value Pr(>|t|)    
(Intercept)        0.56561    0.04425  12.782  < 2e-16 ***
rep_voteshare_std  0.07140    0.06654   1.073  0.28869    
med_age_std       -0.01692    0.04744  -0.357  0.72296    
med_income_std    -0.21669    0.06660  -3.254  0.00211 ** 
---
Signif. codes:  0 '***' 0.001 '**' 0.01 '*' 0.05 '.' 0.1 ' ' 1

Residual standard error: 0.316 on 47 degrees of freedom
Multiple R-squared:  0.4394,    Adjusted R-squared:  0.4036 
F-statistic: 12.28 on 3 and 47 DF,  p-value: 4.689e-06

Adjusted R2

  • Adjusted R2
  • Example
  • Figure
  • One can show that a models R2 always increases as we add predictors, even when they’re unrelated to the outcome

  • The adjusted R2 adjusts for this by weighting the R2 of a model by the number of predictors

adj. R2=1−RSS/(n−k)TSS/(n−1)

ex_df <- data.frame(
  y = rnorm(100) 
  ) %>%
    bind_cols(
      data.frame(matrix(rnorm(10000), ncol=100))
    ) %>% janitor::clean_names()


the_formulas <- list()
for(i in 2:51){
  vars <- names(ex_df)[2:i]
  the_formulas[[i-1]] <- paste("y~",paste(vars,collapse = "+"))
}

the_formulas %>% 
  purrr::map(as.formula) %>% 
  purrr::map(lm, data=ex_df) %>% 
  purrr::map(summary) %>% 
  purrr::map_df(glance) -> r2_df

r2_df %>% 
  ggplot(aes(df, r.squared))+
  geom_point(aes(col = "R^2"))+
  geom_line()+
  geom_point(aes(y=adj.r.squared,col = "Adjusted R^2"))+
  geom_line(aes(y=adj.r.squared))+
  labs(
    x = "Number of predictors",
    y = "Proportion of Variance Explained",
    title = "Adding unrelated predictors increases a model's R^2\nwhile the Adjusted R^2 provides a better indicator of poor fit ",
    col ="Model fit"
  ) -> fig_r2

Using R2 to compare models

  • ANOVA
  • m5
  • Table
  • Anova

When models are nested (larger models contain all the predictors of smaller models), we can ask, does including the additional predictors in the larger model explain more variation in the outcome than we would expect would happen if we just added additional, random variable.

Formally we call this process an Analysis of Variance (ANOVA)

Let’s assess the added predictive power of I(percent_vaccinated^2) by estimating a model without it and comparing models using ANOVA

# Estimate model without polynomial
m5 <- lm(new_deaths_pc_14day ~ percent_vaccinated  + rep_voteshare_std + med_age_std + med_income_std, covid_lab
           )
Statistical models
  Model 1 Model 2
(Intercept) 6.194** 2.532***
  (2.186) (0.657)
percent_vaccinated -0.169* -0.035**
  (0.077) (0.012)
percent_vaccinated^2 0.001  
  (0.001)  
rep_voteshare_std -0.062 -0.089
  (0.081) (0.082)
med_age_std 0.053 0.071
  (0.053) (0.053)
med_income_std -0.114 -0.119
  (0.068) (0.070)
R2 0.561 0.531
Adj. R2 0.512 0.490
Num. obs. 51 51
***p < 0.001; **p < 0.01; *p < 0.05

The anova suggests that including a polynomial provides a marginal improvement to fit (p < 0.10)

anova(m5, m4)
Analysis of Variance Table

Model 1: new_deaths_pc_14day ~ percent_vaccinated + rep_voteshare_std + 
    med_age_std + med_income_std
Model 2: new_deaths_pc_14day ~ percent_vaccinated + I(percent_vaccinated^2) + 
    rep_voteshare_std + med_age_std + med_income_std
  Res.Df    RSS Df Sum of Sq      F  Pr(>F)  
1     46 3.9268                              
2     45 3.6758  1   0.25098 3.0725 0.08644 .
---
Signif. codes:  0 '***' 0.001 '**' 0.01 '*' 0.05 '.' 0.1 ' ' 1

Standardized vs Non Standardized Predictors

  • m6
  • Table
  • Comments

Why are we using standardized predictors?

Standardizing variables is a common transformation:

z-scores of x=xi−μxσx When variables are measured on very different scales or units (e.g. age in years, income in dollars), using standardized (or normalized) versions rescales them to a unit-less measures that all have:

  • a mean of zero
  • a standard deviation of 1
# Estimate model  with unstandardized predictors
m6 <- lm(new_deaths_pc_14day ~ percent_vaccinated  + rep_voteshare + med_age + med_income, covid_lab
           )
Statistical models
  Model 1 Model 2
(Intercept) 2.532*** 2.470*
  (0.657) (1.063)
percent_vaccinated -0.035** -0.035**
  (0.012) (0.012)
rep_voteshare_std -0.089  
  (0.082)  
med_age_std 0.071  
  (0.053)  
med_income_std -0.119  
  (0.070)  
rep_voteshare   -0.007
    (0.007)
med_age   0.029
    (0.022)
med_income   -0.000
    (0.000)
R2 0.531 0.531
Adj. R2 0.490 0.490
Num. obs. 51 51
***p < 0.001; **p < 0.01; *p < 0.05

When should you standardize variables? It depends on what you’re trying to do.

  • It’s the same information, just rescaled:
coef(m5)[5] # Standardized coef
med_income_std 
    -0.1188812 
coef(m6)[5] # Unstandaried
  med_income 
-1.10947e-05 
coef(m6)[5]*sd(covid_lab$med_income) # Same as standardized
med_income 
-0.1188812 
  • Can facilitate comparison and estimation

  • Might make interpretation easier (but the onus is on you to describe your models well)

    • Don’t standardized binary predictors

Difference-in-Differences

Motivating Example: What causes Cholera?

  • In the 1800s, cholera was thought to be transmitted through the air.

  • John Snow (the physician, not the snack), to explore the origins eventunally concluding that cholera was transmitted through living organisms in water.

  • Leveraged a natural experiment in which one water company in London moved its pipes further upstream (reducing contamination for Lambeth), while other companies kept their pumps serving Southwark and Vauxhall in the same location.

Notation

Let’s adopt a little notation to help us think about the logic of Snow’s design:

  • D: treatment indicator, 1 for treated neighborhoods (Lambeth), 0 for control neighborhoods (Southwark and Vauxhall)

  • T: period indicator, 1 if post treatment (1854), 0 if pre-treatment (1849).

  • Ydi(t) the potential outcome of unit i

    • Y1i(t) the potential outcome of unit i when treated between the two periods

    • Y0i(t) the potential outcome of unit i when control between the two periods

Causal Effects

The individual causal effect for unit i at time t is:

τit=Y1i(t)−Y0i(t)

What we observe is

Yi(t)=Y0i(t)⋅(1−Di(t))+Y1i(t)⋅Di(t)

D only equals 1, when T equals 1, so we never observe Y0i(1) for the treated units.

In words, we don’t know what Lambeth’s outcome would have been in the second period, had they not been treated.

Average Treatment on Treated

Our goal is to estimate the average effect of treatment on treated (ATT):

τATT=E[Y1i(1)−Y0i(1)|D=1]

That is, what would have happened in Lambeth, had their water company not moved their pipes

Average Treatment on Treated

Our goal is to estimate the average effect of treatment on treated (ATT):

We we can observe is:

Pre-Period (T=0) Post-Period (T=1)
Treated Di=1 E[Y0i(0)|Di=1] E[Y1i(1)|Di=1]
Control Di=0 E[Y0i(0)|Di=0] E[Y0i(1)|Di=0]

Data

Because potential outcomes notation is abstract, let’s consider a modified description of the Snow’s cholera death data from Scott Cunningham:

Company 1849 (T=0) 1854 (T=1)
Lambeth (D=1) 85 19
Southwark and Vauxhall (D=0) 135 147

How can we estimate the effect of moving pumps upstream?

Recall, our goal is to estimate the effect of the the treatment on the treated:

τATT=E[Y1i(1)−Y0i(1)|D=1]

Let’s conisder some strategies Snow could take to estimate this quantity:

Before vs after comparisons:

  • Snow could have compared Labmeth in 1854 (E[Yi(1)|Di=1]=19) to Lambeth in 1849 (E[Yi(0)|Di=1]=85), and claimed that moving the pumps upstream led to 66 fewer cholera deaths.

  • Assumes Lambeth’s pre-treatment outcomes in 1849 are a good proxy for what its outcomes would have been in 1954 if the pumps hadn’t moved (E[Y0i(1)|Di=1]).

  • A skeptic might argue that Lambeth in 1849 ≠ Lambeth in 1854

Company 1849 (T=0) 1854 (T=1)
Lambeth (D=1) 85 19
Southwark and Vauxhall (D=0) 135 147

Treatment-Control comparisons in the Post Period.

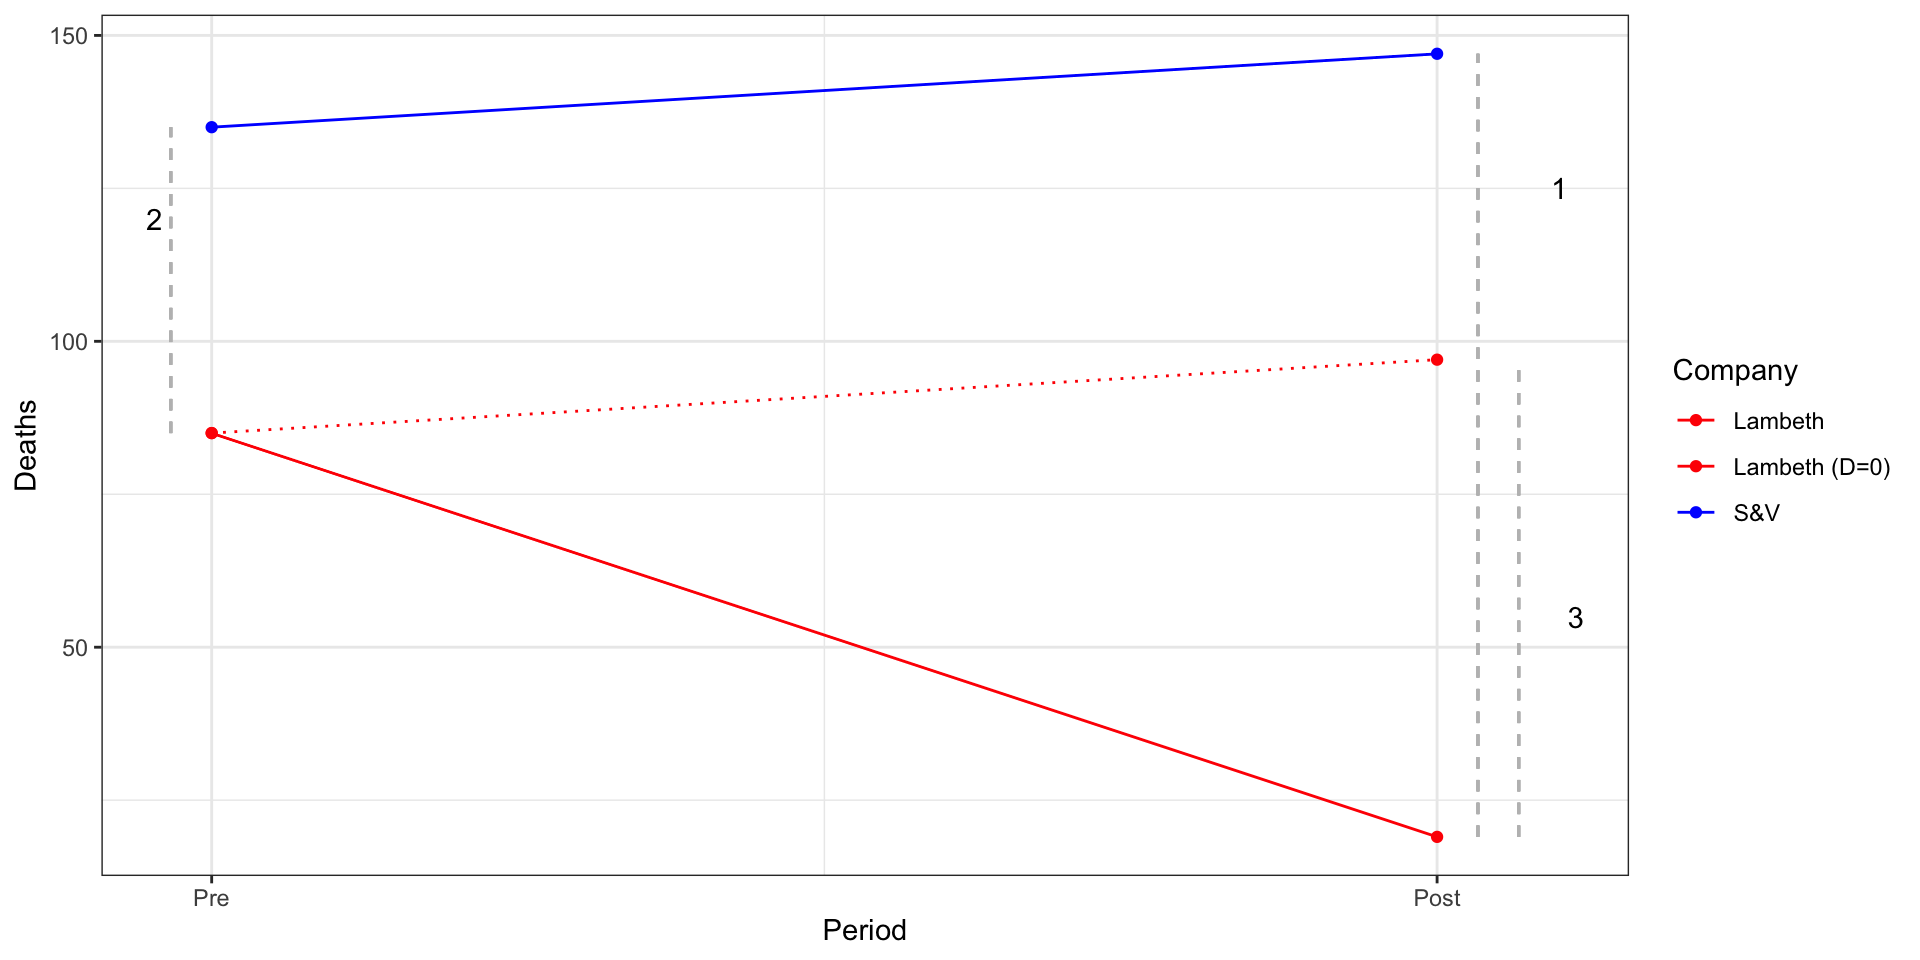
  • Snow could have compared outcomes between Lambeth and S&V in 1954 (E[Yi(1)|Di=1]−E[Yi(1)|Di=0]), concluding that the change in pump locations led to 128 fewer deaths.

  • Here the assumption is that the outcomes in S&V and in 1854 provide a good proxy for what would have happened in Lambeth in 1954 had the pumps not been moved (E[Y0i(1)|Di=1])

  • Again, our skeptic could argue Lambeth ≠ S&V

Company 1849 (T=0) 1854 (T=1)
Lambeth (D=1) 85 19
Southwark and Vauxhall (D=0) 135 147

Difference in Differences

To address these concerns, Snow employed what we now call a difference-in-differences design,

There are two, equivalent ways to view this design.

{E[Yi(1)|Di=1]−E[Yi(1)|Di=0]}⏟1. Treat-Control |Post −{E[Yi(0)|Di=1]−E[Yi(0)|Di=0]⏞Treated-Control|Pre

  • Difference 1: Average change between Treated and Control in Post Period

  • Difference 2: Average change between Treated and Control in Pre Period

Difference in Differences

{E[Yi(1)|Di=1]−E[Yi(1)|Di=0]}⏟1. Treat-Control |Post −{E[Yi(0)|Di=1]−E[Yi(0)|Di=0]⏞Treated-Control|Pre Is equivalent to:

{E[Yi(1)|Di=1]−E[Yi(0)|Di=1]}⏟Post - Pre |Treated −{E[Yi(1)|Di=0]−E[Yi(0)|Di=0]⏞Post-Pre|Control

  • Difference 1: Average change between Treated over time
  • Difference 2: Average change between Control over time

Difference in Differences

You’ll see the DiD design represented both ways, but they produce the same result:

τATT=(19−147)−(85−135)=−78

τATT=(19−85)−(147−135)=−78

Identifying Assumption of a Difference in Differences Design

The key assumption in this design is what’s known as the parallel trends assumption: E[Y0i(1)−Y0i(0)|Di=1]=E[Y0i(1)−Y0i(0)|Di=0]

  • In words: If Lambeth hadn’t moved its pumps, it would have followed a similar path as S&V

Parallel Trends

Using linear regression to estimate a Difference in Difference

  • Concept
  • Code
  • Data
  • DiD
  • Figure
  • Recall that linear regression provides a…
    • linear estimate of the conditional expectation function
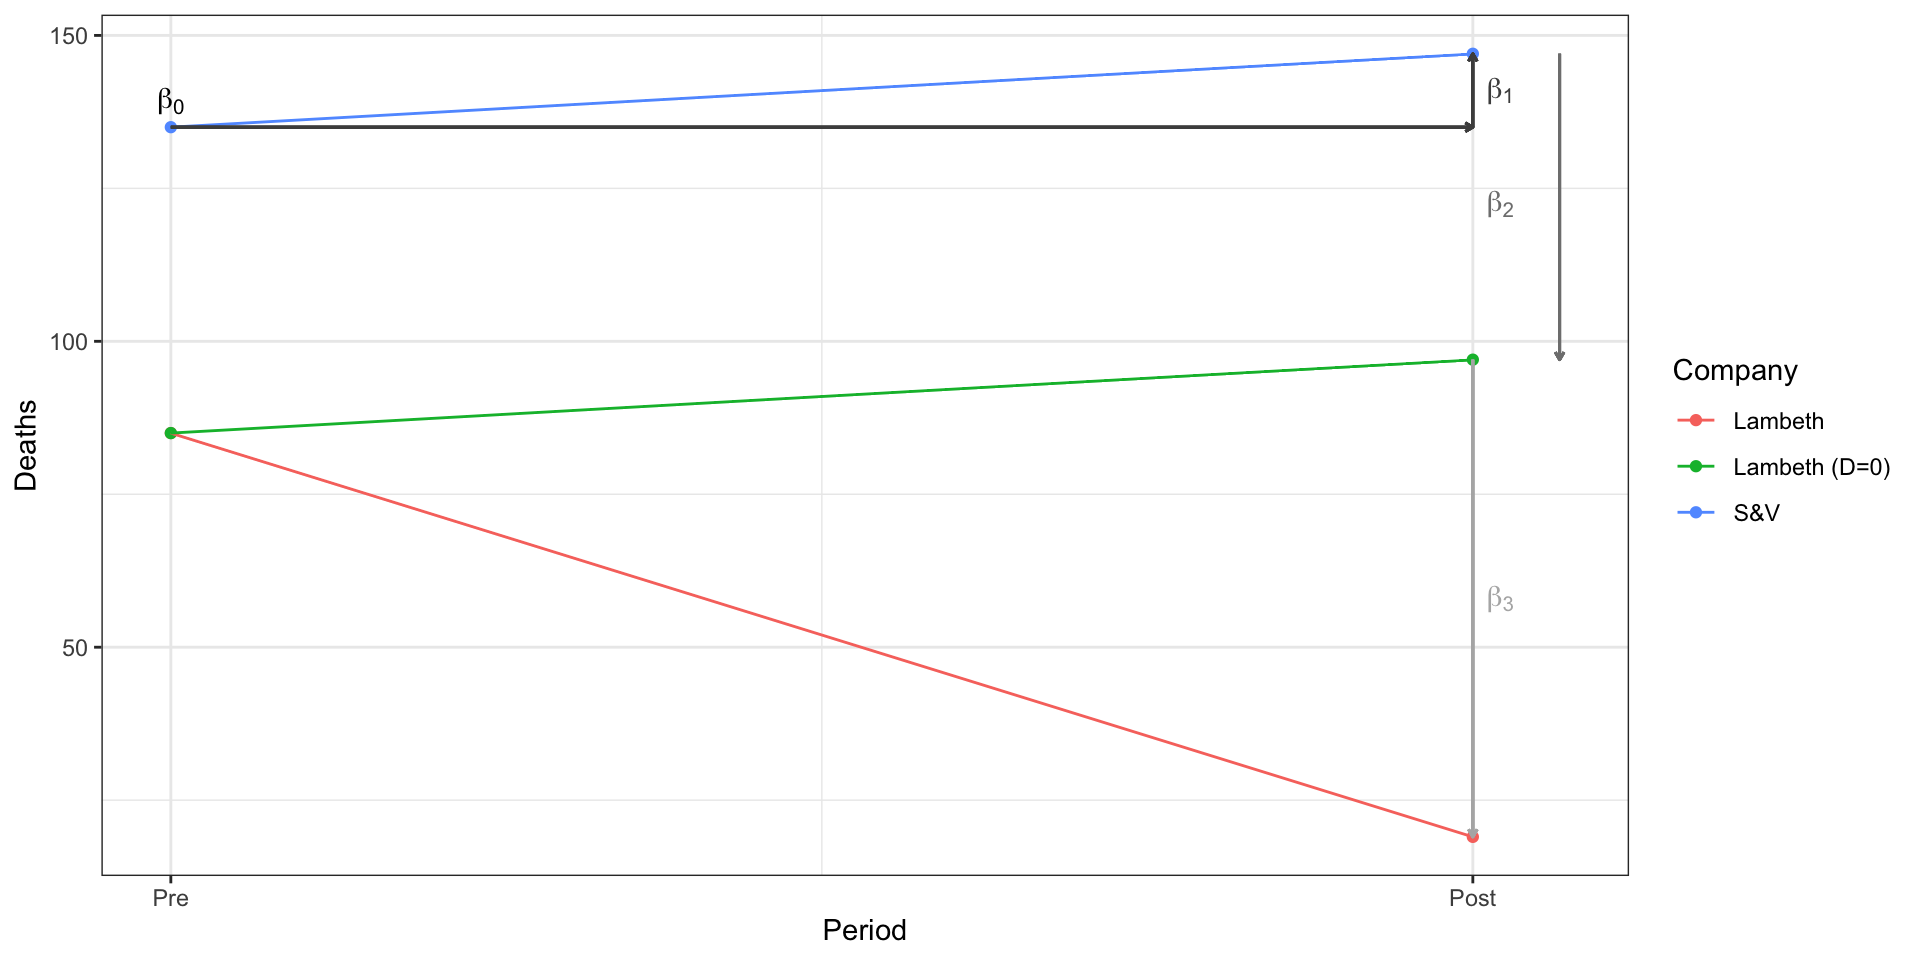
  • In the canonincal pre-post, treated and control DiD, β3 from the following linear regression will give us the ATT:

y=β0+β1Post+β2Treated+β3Post×Treated⏟τATT

cholera_df <- tibble(
  Period = factor(c("Pre","Pre","Post","Post"),
                  levels = c("Pre","Post")),
  Year = c(1849,1849, 1854,1854),
  Treated = factor(c("Control","Treated","Control","Treated")),
  Company = c("S&V","Lambeth","S&V","Lambeth"),
  Deaths = c(135,85,147,19)
)

m_did <- lm(Deaths~Period + Treated + Period:Treated, cholera_df)

m_did

Call:
lm(formula = Deaths ~ Period + Treated + Period:Treated, data = cholera_df)

Coefficients:
              (Intercept)                 PeriodPost  
                      135                         12  
           TreatedTreated  PeriodPost:TreatedTreated  
                      -50                        -78  
 
Statistical models
  Model 1
(Intercept) 135.00
Post (1854) 12.00
Treated (Lambeth) -50.00
Post X Treated (DID) -78.00
R2 1.00
Adj. R2  
Num. obs. 4
***p < 0.001; **p < 0.01; *p < 0.05

  • β0= Outcome in control (S&V) before treatment
  • β1= Fixed, unit invariant differences between pre and post periods
  • β2= Fixed, time invariant differences between treated and control
  • β3= Difference-in-Differences = E[Y1i(1)−Y0i(1)|D=1]

Summary

  • A Difference in Differences (DiD, or diff-in-diff) design combines a pre-post comparison, with a treated and control comparison

  • Differencing twice accounts for fixed differences across units and between periods

    • But not time varying differences across units…
  • The key identifying assumption of a DiD design is the assumption of parallel trends

    • Absent treatment, treated and control groups would see the same changes over time.
    • Hard to prove, possible to assess if we have multiple periods of pre-treatment observations

Generalizing Diff-in-Diff with Linear Regression

  • Linear regression allows us to generalizes Diff-in-Diff to multiple periods and treatment interventions, with fixed effects

yit=αi⏞Unit FE+γt⏟Period FE+τ∗dit⏞Treatment+Xβ⏟Covariates+ϵit

  • Unit fixed effects (αi)control for time-invariant differences across units
  • Period fixed effects (γi) control for unit-invariant differences across periods
  • τ corresponds the Difference-in-Difference estimate for a two-way fixed effects regression

Extensions and limitations

  • Interpretation of two-way fixed effects DiD estimator is complicated…
    • Goodman-Bacon (2021)
    • Callaway and Sant’Anna (2021)
  • More pre-treatment periods allow you assess “parallel trends” assumption
  • Alternative methods
    • Synthetic control
    • Event Study Designs
  • What if you have multiple treatments or treatments that come and go?
    • Panel Matching
    • Generalized Synthetic control

Applications

  • Card and Krueger (1994) What effect did raising the minimum wage in NJ have on employment

  • Abadie, Diamond, & Hainmueller (2014) What effect did German Unification have on economic development in West Germany

  • Malesky, Nguyen and Tran (2014) How does decentralization influence public services?

Previewing Lab 7

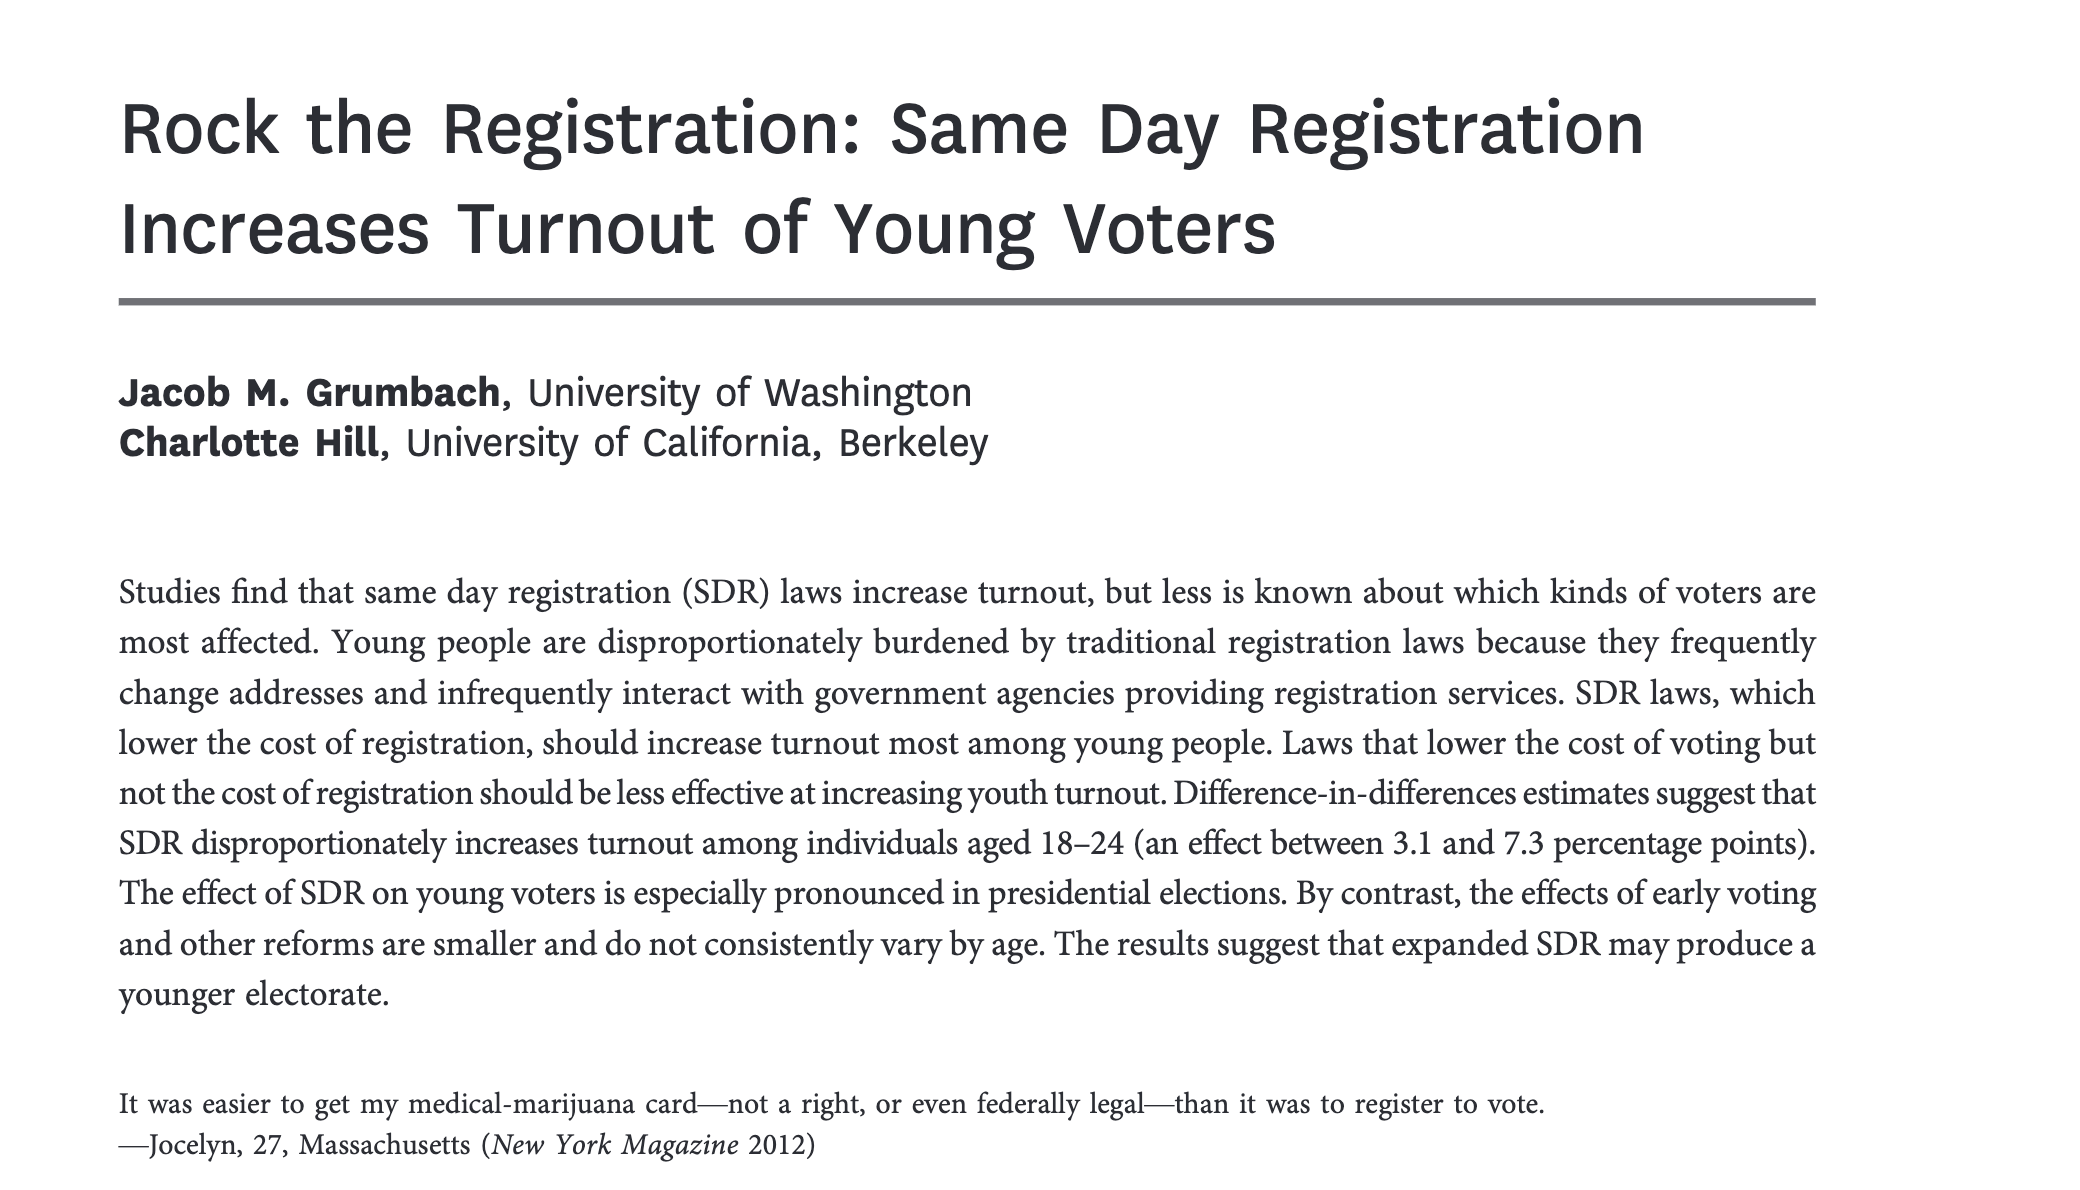
Replicating Grumbach and Hill (2022)

  • In this week’s lab, we’ll be conducting a partial replication of Grumbach and Hill (2022) “Rock the Registration: Same Day Registration Increases Turnout of Young Voters.”

  • On Thursday, we’ll walk through

    • the paper’s design and argument
    • setting up and exploring the data
    • reproducing some descriptive figures
  • Next Thursday, we’ll focus on replicating and understanding the main results

General Structure of Labs 7-8

Lab 7:

  • Summarize the study
  • Download and load the data
  • Recode the data
  • Merge the data
  • Recreate Figures 1 and 2

Lab 8:

  • Estimate some baseline models to understand Two-Way Fixed Effects
  • Estimate some of the models in Figure 3
  • Extend the study, perhaps considering SDR by race or gender

Reading Grumbach and Hill (2022)

Reading Grumbach and Hill (2022), focus on being able to answer the following:

  • What’s the research question?
    • General RQ: First sentence, second paragraph, p. 405
    • Specific RQs: p. 405-406
  • What’s the theoretical framework?
    • Intro and Theory of Registration, p. 407-409
  • What’s the empirical design?
    • Methods pp. 409-410
  • What’s are the main results?
    • Results pp. 410-413
    • Figure 3 in particular

Q1: Download the replication files

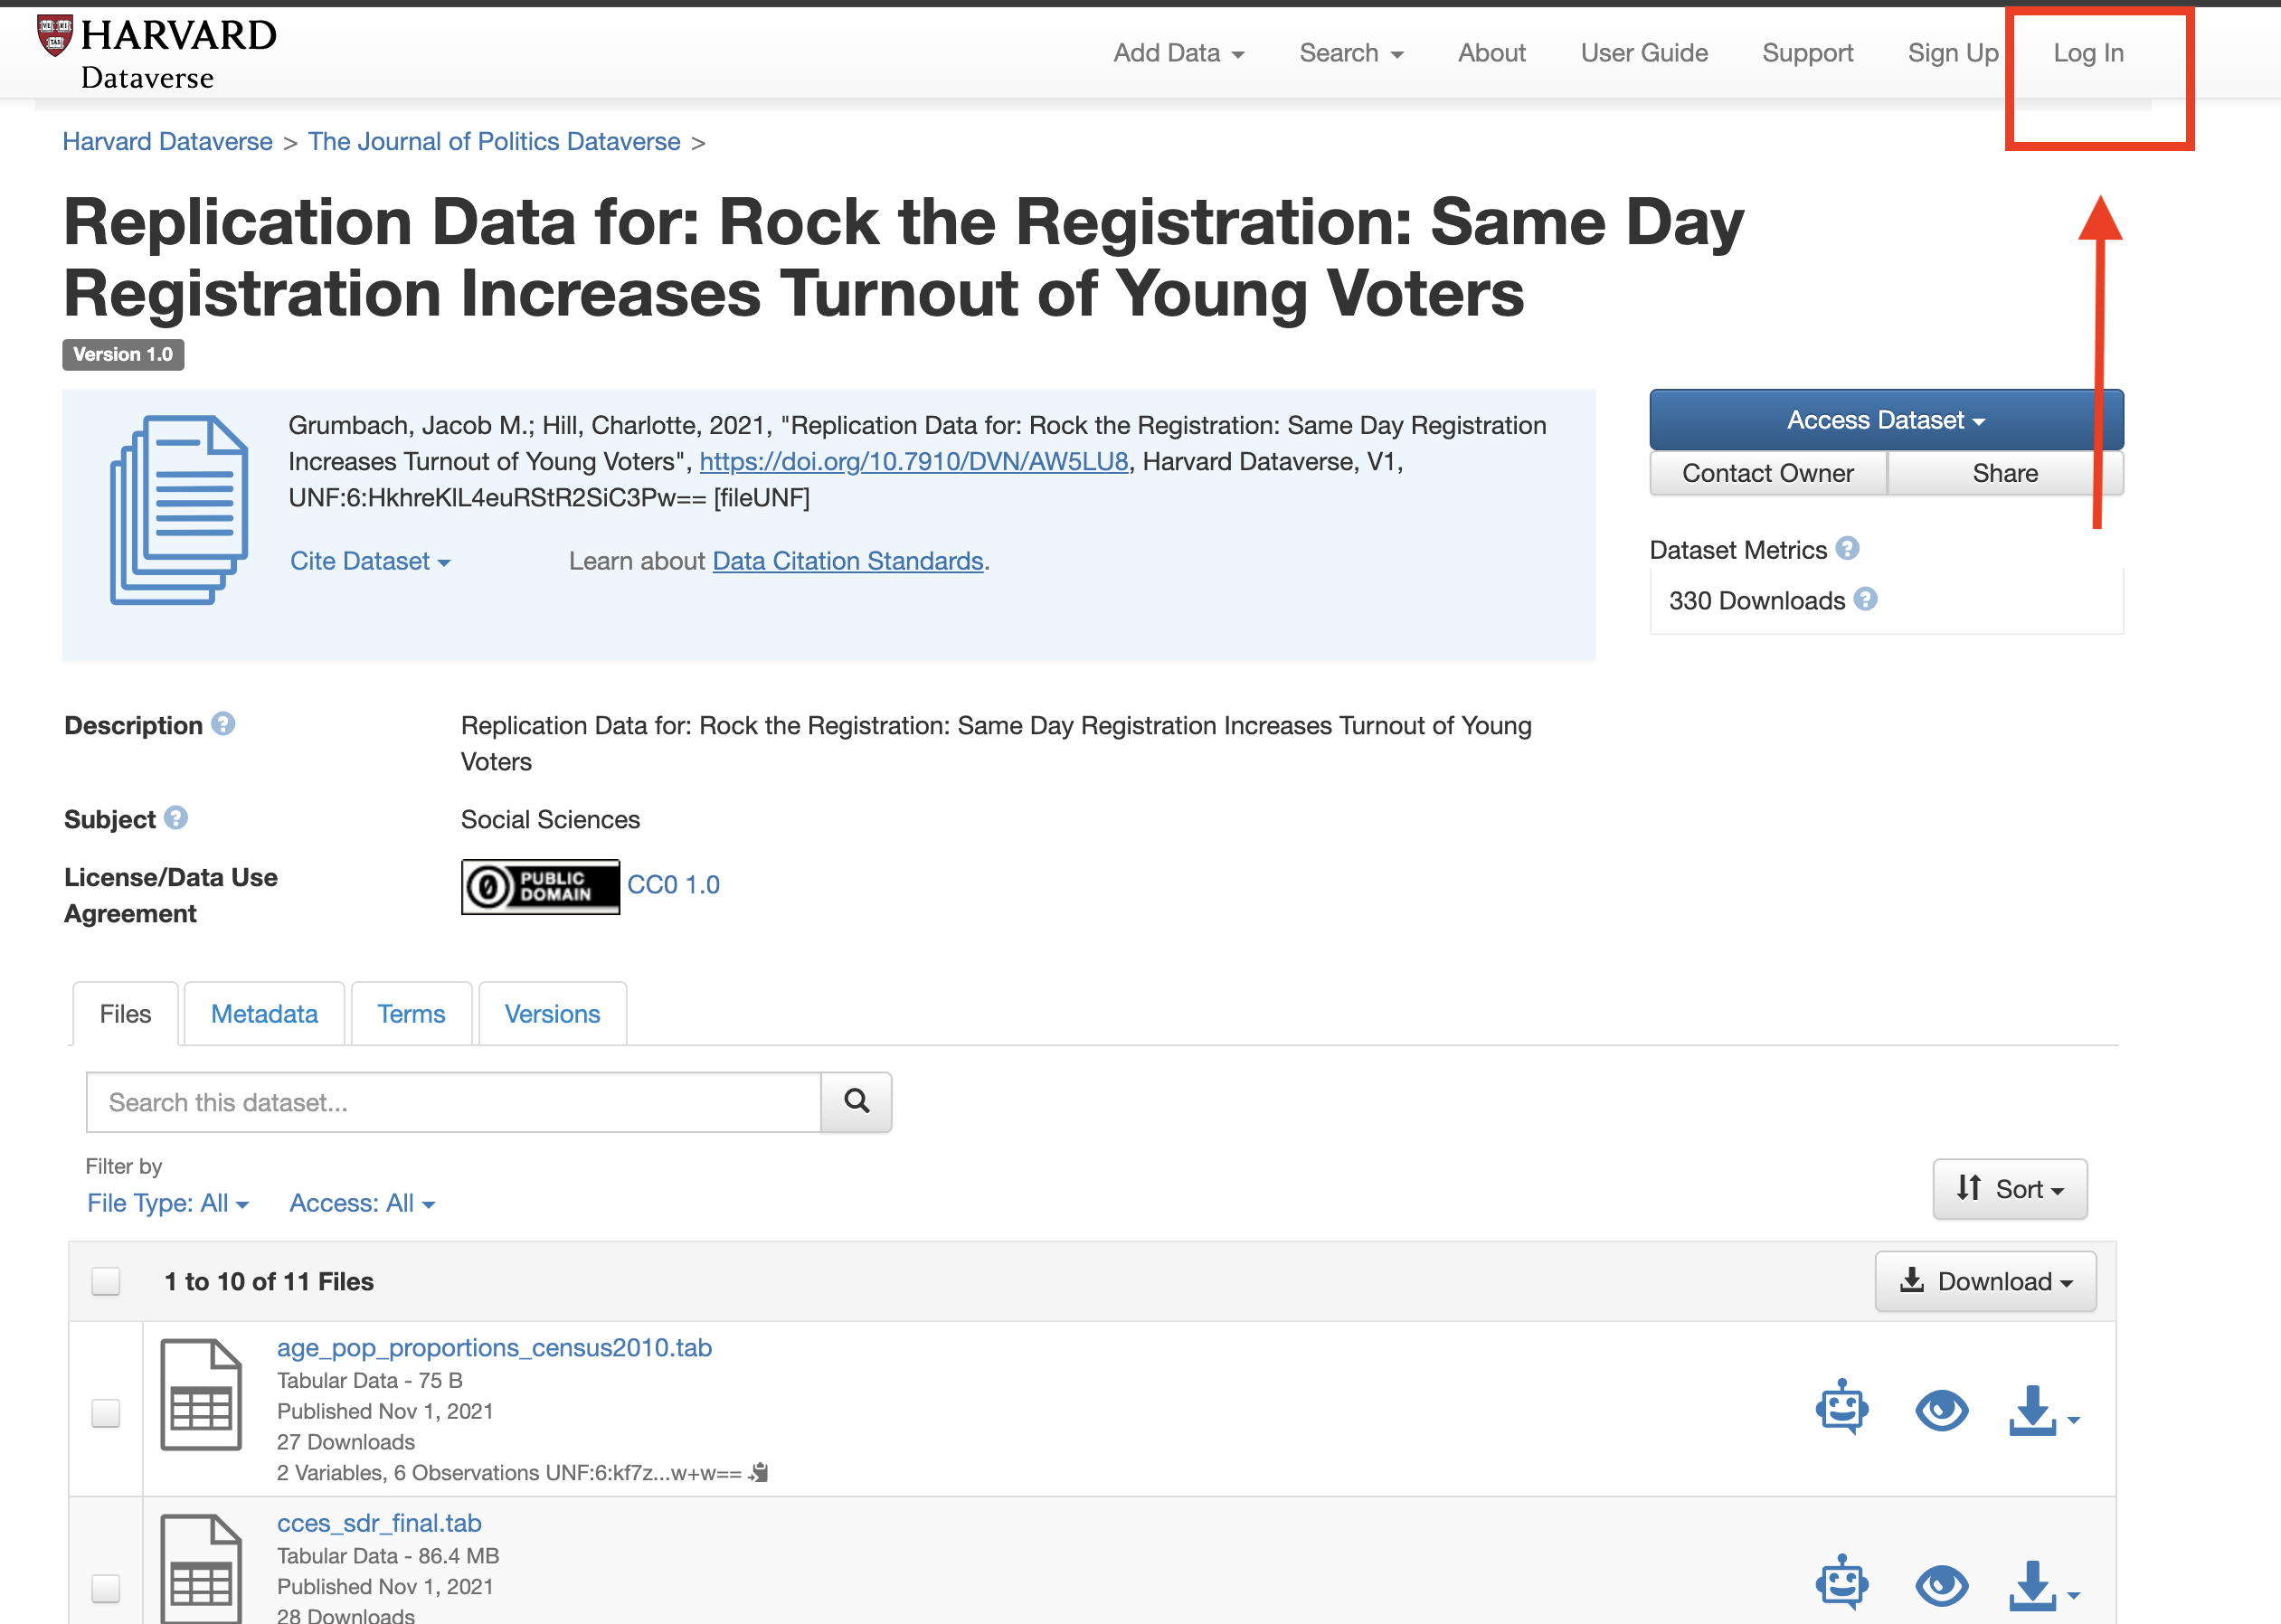
Rather than downloading the files directly from the paper’s replication archives, in this lab, we will download the replication files to your computers and then load the data into R from where they’re saved

Please click here and let’s download the files together.

1. Go to the paper’s dataverse

Please click here

2. Log in through Brown

3. Select all of the files

Make sure to Select all 11 files in this dataset

4. Download the files in their original format

5. Save and unzip the downloaded files into your course folder where your labs are saved

Q3: Load the data into R

If you’ve saved the dataverse_files into the folder where your lab is saved, you should be able to run the following code after setting the working directory to source file location:

# Remember to set working directory:
# Session > Set working directory > Source file location

# Load fips_codes
fips_codes <- read_csv("dataverse_files/fips_codes_website.csv")%>%
  janitor::clean_names()

# Load policy data
data <- readRDS("dataverse_files/policy_data_updated.RDS")%>%
  janitor::clean_names()

# Load CPS data
cps <- read_csv("dataverse_files/cps_00021.csv") %>%
  janitor::clean_names()

Summary

Summary

References

Callaway, Brantly, and Pedro H C Sant’Anna. 2021. “Difference-in-Differences with multiple time periods.” Journal of Econometrics 225 (2): 200–230.
Goodman-Bacon, Andrew. 2021. “Difference-in-differences with variation in treatment timing.” Journal of Econometrics 225 (2): 254–77.
Grumbach, Jacob M, and Charlotte Hill. 2022. “Rock the Registration: Same Day Registration Increases Turnout of Young Voters.” The Journal of Politics 84 (1): 405–17.

POLS 1600

1
POLS 1600 Interpreting and Evaluating Linear Models Updated Apr 22, 2025

  1. Slides

  2. Tools

  3. Close
  • POLS 1600
  • Overview
  • Class Plan
  • Goals
  • Annoucements
  • Setup: Packages for today
  • Feedback
  • What did we like
  • What did we dislike
  • What we’re good at
  • What we’re working on
  • How are we doing?
  • Don’t trust the polls
  • Slide 14
  • What should we do going forward?
  • What does it mean to “control for X”
  • Regression models partition variance
  • Coefficients describe...
  • Why do coefficients change when we control for variables?
  • Residualized Regression
  • What’s a residual
  • Residuals are uncorrelated with X and y^
  • Residualized Regression...
  • Why did the coefficient on Rep Vote Share change in m3 but not m2?
  • Slide 25
  • Statistical models...
  • \[ \text{Covid-19...
  • Statistical models...
  • \[ \text{Deaths}...
  • Statistical models...
  • \[ \text{Deaths}...
  • Using regression to make predictions
  • Using regression to produce predicted values
  • Producing Predicted Values in R
  • Are there decreasing...
  • Evaluating Model Fit
  • Evaluating Model Fit
  • R^2
  • Calculating R2 in R
  • Adjusted R2
  • Using R2 to...
  • Standardized vs Non...
  • Difference-in-Differences
  • Motivating Example: What causes Cholera?
  • Notation
  • Causal Effects
  • Average Treatment on Treated
  • Average Treatment on Treated
  • Data
  • How can we estimate the effect of moving pumps upstream?
  • Before vs after comparisons:
  • Treatment-Control comparisons in the Post Period.
  • Difference in Differences
  • Difference in Differences
  • Difference in Differences
  • Identifying Assumption of a Difference in Differences Design
  • Parallel Trends
  • Using linear regression to estimate a Difference in Difference
  • Summary
  • Generalizing Diff-in-Diff with Linear Regression
  • Extensions and limitations
  • Applications
  • Previewing Lab 7
  • Replicating Grumbach and Hill (2022)
  • Slide 65
  • General Structure of Labs 7-8
  • Reading Grumbach and Hill (2022)
  • Q1: Download the replication files
  • 1. Go to the paper’s dataverse
  • 2. Log in through Brown
  • 3. Select all of the files
  • 4. Download the files in their original format
  • 5. Save and unzip...
  • Q3: Load the data into R
  • Summary
  • Summary
  • References
  • f Fullscreen
  • s Speaker View
  • o Slide Overview
  • e PDF Export Mode
  • r Scroll View Mode
  • b Toggle Chalkboard
  • c Toggle Notes Canvas
  • d Download Drawings
  • ? Keyboard Help